Download

1 / 65
660 likes | 961 Views
Radiocarbon Course Students: These slides are provided for your reference. If you wish to use any of these slides, please make sure to contact the appropriate lecturer first for permission and attribution. Thank you. . Radiocarbon in Ecology and Earth System Science.

E N D
Radiocarbon Course Students: These slides are provided for your reference. If you wish to use any of these slides, please make sure to contact the appropriate lecturer first for permission and attribution. Thank you.
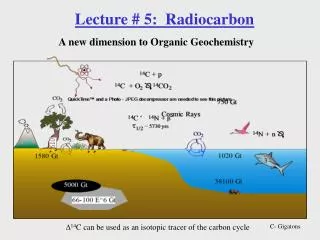
Radiocarbon in Ecology and Earth System Science W.M. Keck Carbon Cycle Accelerator Mass Spectrometry Facility Lab Instructors: Guaciara dos Santos-Winston Xiaomei Xu Lecture Instructors: Sue Trumbore*, Ted Schuur*, John Southon, Ellen Druffel, Jim Randerson, Erv Taylor Logistics: Morgan Sibley * Course coordinators
Goals of the class • Learn about the Earth’s carbon cycle from a 14C perspective Lectures on what is learned from 14C in Ocean, Atmosphere, Land, Paleo C cycles • Introduce you to the details of interpreting radiocarbon data Problem Sets – how does the number you get help answer your question • Preparation of samples for radiocarbon dating by accelerator mass spectrometry (AMS) Laboratory methods – taking and analyzing the sample so that you know what you are measuring
Outline of Today’s Lecture • Global cycles of carbon and 14C • Isotope basics – how radiocarbon is made and distributed in the environment • Reporting/Interpreting of radiocarbon data (an intro to problems part of the course) • Steps involved in making a 14C measurement (a brief introduction to the lab part of the course) • A brief orientation to the building and AMS lab
Earth System Science is the study of Earth as a coupled and interacting system of Land Atmosphere Hydrosphere Biosphere People Involves: physics of transport phase transformations chemical interactions biological reactions and human resource use
Forms of Carbon in the Earth System Atmosphere (750) Carbon dioxide (gas) CO2 (7)Methane (gas) CH4 Ocean (38,000) mostly dissolved ions (HCO3- (bicarbonate) and CO32- (carbonate) Land (650) Living organic matter (1500) Dead organic matter (soil) Land, air, water Fossil organic matter (28,000,000) coal, petroleum, natural gas Limestone (~50,000,000) CaCO3 Solid Earth
Distribution of Carbon; 1015 grams = 1 Petagram (Pg) ATMOSPHERIC CO2 640 X1015 g C Response times are seasons to centuries LIVING BIOMASS 830 X1015 g C DISSOLVED ORGANICS 1500 X1015 g C Response times are centuries to millennia ORGANIC CARBON IN SEDIMENTS AND SOILS 3500 X1015 g C Timescales we can address with 14C CO2 DISSOLVED IN OCEANS 38,000 X1015 g C LIMESTONE AND SEDIMENT CARBONATES 18,000,000 X1015 g C Response times are tens of thousands to millions of years TRAPPED ORGANIC CARBON: NATURAL GAS, COAL PETROLEUM, BITUMEN, KEROGEN 25,000,000 X1015 g C
Changes in CO2 on thousand year timescales – glacial to interglacial change indicates past changes in C cycle linked to climate Methane Temperature Carbon Dioxide http://www.realclimate.org/epica.jpg
Where we are predicted to end up in the next century is far outside the ‘norm’ - what kinds of climate/CO2 feedbacks will operate in future? IPCC high scenario 2100, 975 ppm IPCC low scenario 2100, 540 ppm 2009, 387 ppm 1959, 316 ppm Years before present
What makes us sure current CO2 increase is caused by humans? Depletion of Atmospheric 14C – the Suess Effect Preindustrial atmosphere Tree rings Fewer 14C atoms per 12C atom in CO2 Fossil fuel contains zero radiocarbon (millions of years means so many half-lives of 14C that it is all decayed away – so adding CO2 derived from fossil fuel burning reduces 14C over time
Deforestation: Clearing of forests (formerly in the northern hemisphere, now in the tropics) Responsible for ~40% of total C emissions since 1850 In 1990s 0.5 to 2 GtC/year (8-25% of total emissions)
Carbon dioxide mixing ratio (parts per million) 1 ppm = 1 liter CO2 in 1,000,000 liters air Where does the rest go? Also, what happens to CO2 from deforestation (not counted here)? Source: Ralph Keeling, http://scrippsco2.ucsd.edu/graphics_gallery
Observed atmosphere increase Land and Ocean Sinks Fossil Fuel Emission + = 1960 – 1988 1989 – 2003/7 ? Land Gigatons of Carbon per year Ocean ? Ocean Atmo-sphere Atmo-sphere Fossil C Where it goes Emissions Fossil C Where it goes Emissions Sarmiento et al. 2010
Some of the emitted CO2 is dissolving in the oceans (tomorrow’s lecture) Surface waters equilibrate quickly; CO2 reacts with water Falling particles move organic carbon into the deep ocean Sinking waters in polar regions isolate water that has equilibrated at the surface, removing CO2 for thousands of years
Observed atmosphere increase Land and Ocean Sinks Fossil Fuel Emission + = 1960 – 1988 1989 – 2003/7 Land Gigatons of Carbon per year Ocean Ocean Atmo-sphere Atmo-sphere Fossil C Where it goes Emissions Fossil C Where it goes Emissions Sarmiento et al. 2010
Land Uptake Net Land Flux Deforestation - = Year-to-year variation in land uptake Is ± 3 PgC yr-1 Sarmiento et al. 2010 Biogeosciences 7, 2351-2367
Forest Cover in Massachusetts 1830 to 1985 • Processes on Land that could be taking up the residual CO2: • Regrowth of some forests that were previously cut • Thickening of forests because of forest fire suppression? • Fertilization of forests by increased N deposition or CO2 • - Improved agricultural management Foster, Motzkin and Slater 1998
Some big questions for the future • Can we count on ocean and land sinks to continue to take up ~ half of the CO2 we emit? • What process(es) is (are) responsible for the land uptake? • What feedback mechanisms could lead to large changes in the future C cycle? • What can we learn from past changes in the C cycle? More details in the week’s lectures…..
Carbon Isotopes – stable and radioactive The naturally occurring isotope of carbon: C-12 (98.8%) 6 protons, 6 neutrons C-13 (1.1%) 6 protons, 7 neutrons C-14 (< 10-10 %) 6 protons, 8 neutrons 14C is the longest lived radioactive isotope of C, and decays to 14N by emitting a b particle (electron):
Isotopes of C contain independent information 13C – patterns in the environment reflect mass-dependent fractionation (partitioning among phases at equilibrium and differences in reaction rates) 14C – Reflects time or mixing Mass-dependent fractionation is corrected out of reported data using 13C
Stable C isotope – 13C Stable isotope (13C) fractionation: Kinetic effects: 13C reacts more slowly than 12C 13CO2 diffuses more slowly than 12CO2 Equilibrium effects: 12CO2 + 13CO32- +H2O = 13CO2 + 12CO32- +H2O 13C will partition into the species where overall energy is lowest (strongest bond or phase with least randomness). Reaction rates and equilibrium partitioning coefficients are dependent on state variables like T, P
Isotope data are expressed as ratios (e.g. rare isotope/abundant isotope) compared to a standard It is nearly impossible to measure the absolute abundances of isotopes accurately, but differences in relative abundance from one sample to another are easier to measure For measurements made by different laboratories to be comparable, data are expressed as the ratio to a universally accepted standard
By definition, the standards have d = 0‰ A leaf with d13C value of –28 ‰ has an “isotope ratio” (Rplant) of (-28/1000) + 1, or 0.972. Calcium carbonate with d18OPDB of +2 ‰ has Of (+2/1000) +1 = 1.002
Fossil fuel has d13C of -21 to -27 per mil If all emissions are taken up by the biosphere, the d13C of atmospheric CO2 should not change. Dissolution in the ocean preferentially removes 12C more than 13C, so we would expect a decline in 13C of atmospheric CO2 http://scrippsco2.ucsd.edu/graphics_gallery
O2 is less soluble than CO2 – so it also provides a way to constrain relative ocean and land sink strengths (i.e. it is like another ‘isotope’ of C ) Decline in O2 is faster than increase in CO2 Stoichiometry says O2/CO2 for fossil fuel burning/biosphere should be ~-1.1 http://scrippso2.ucsd.edu/plots
Unlike stable isotopes, which can be moved around but are always conserved, radiocarbon is constantly created and destroyed Loss by radioactive decay Production in the stratosphere Total number of 14C atoms (N) -l N The total amount of radiocarbon on Earth can (and does) vary (Friday’s lecture)
14C is continually produced in the upperatmosphere by nuclear reaction of nitrogen with cosmic radiation. A smaller amount is produced by cosmic rays interacting with atoms in minerals at the Earth’s surface – we will ignore that in this class Cosmic ray proton thermal neutron 14N nucleus 14C nucleus spallation products Oxidation, mixing Ocean/biosphere exchange stratosphere 14CO2 troposphere
typical pre-industrial ratio of 14C/12C divided by the Modern (i.e. atmospheric) 14C/12C ratio Amount of carbon (x1016 moles) per cent of total 14C in the major global C reservoirs 6 1.01.7-2.0% Atmosphere (CO2) 30 0.958-10% 6 0.971.6-2% Surface Ocean (DIC) Terrestrial Biota 280 0.8465-78% 13 0.903-4% Deep Ocean (DIC) Soil Organic Matter 10 0.62% DOC Where the 14C is depends on (1) how much C is there (2) how fast it exchanges with the atmosphere 7-70 0.95 2-18% Coastal / Marine Sediment
Radiocarbon is made a second way – from high energy in nuclear explosions “bomb 14C”
http://www.iup.uni-heidelberg.de/institut/forschung/groups/kk/14co2.htmlhttp://www.iup.uni-heidelberg.de/institut/forschung/groups/kk/14co2.html
Radiocarbon data are reported as the ratio of 14C/12C with respect to a standard with known 14C/12C ratio: (“Modern” is 1950) Ninety-five percent of the activity of Oxalic Acid I from the year 1950
Why does radiocarbon data reported as Fraction Modern or D14C have a correction for mass dependent fractionation? CO2 in air d13C = -8 ‰ Leaf d13C = -28 ‰ 14C -12C mass difference is twice that of 13C – 12C Therefore a 20 ‰ difference in 13C means ~ 40 ‰ difference in 14C Expressed in 14C years this is an apparent age difference of -8033*ln(.96) = 330 years
The 14C standard : Oxalic Acid I The principal modern radiocarbon standard is N.I.S.T Oxalic Acid I (C2H2O4), made from a crop of 1955 sugar beets. Ninety-five percent of the activity of Oxalic Acid I from the year 1950 is equal to the measured activity of the absolute radiocarbon standard which is 1890 wood (chosen to represent the pre-industrial atmospheric 14CO2), corrected for radioactive decay to 1950. This is defined as Modern, which is ~1.12 14C atom for every trillion 12C atoms A range of standards with different 14C/12C ratios is maintained by the International Atomic Energy Agency (IAEA).
The ways we use radiocarbon to study the carbon cycle: Determining the age of C in a closed system age of pollen, foraminifera, seeds As a source tracer: mixing of sources with different 14C signatures For open systems, a measure of the rate of exchange of C with other reservoirs As a (purposeful) tracer tracing pathways (allocation) or rates We use different ways of expressing radiocarbon data for each of these applications
Different ways to report 14C data depend on the application (Stuiver and Polach 1977) Expressions that do not depend on the year you make the measurement or take the sample: Fraction Modern (FM) 0.80 Per cent modern (100*FM) 80% D = (FM – 1) * 1000 -200 ‰ (this is equivalent to the stable isotope d notation) Radiocarbon age (calculated using FM)
Radiocarbon Age: used for closed systems in which carbon has resided for hundreds to thousands of years Radioactivity = number of decays per unit time = dN/dt dN/dt = -l14N, where N is the number of 14C atoms; dN/N = -l14dt T = (-1/ l14)ln (N(t)/N(0)) If radiocarbon production rate and its distribution among atmosphere, ocean and terrestrial reservoirs is constant, Then N(0) = atmospheric 14CO2 value. Note that N(t)/N(0) is then the Fraction Modern (F) [Prove to yourself: t1/2 = ln(2)/l14 ] F Drops to 0.5 in 5730 years (t1/2) Drops to 0.25 in 2*t1/2 years t1/2 Years
Radiocarbon Age = -(1/l14)*ln(F) Where F is Fraction Modern andl14 is the decay constant for 14C The half life (t1/2 = ln(2)/l14) used to calculate radiocarbon ages is the one first used by Libby (5568 years). A more recent and accurate determination of the half-life is 5730 years. To convert a radiocarbon age to a calendar age, the tree ring calibration curve is used (we’ll do a problem on this tomorrow). More on this in the History lecture later …..
Fraction Modern, D, 14C age all report the ratio in the year of measurement, which will not vary as time goes on because radiodecay in standard and sample occurs at the same rate (l). Ages are always reported as years before 1950, but the ratio will be the same as that measured in 2007 0.95*OXI 14C/12C ratio Sample made or collected before 1950 Time 2007 1950
One of the applications is to figure out past changes in the 14C of atmospheric CO2 using known-age samples; for this we use D (the same as D14C pre-1950, but not after 1950) Correct for decay of 14C between T and 1950 0.95*OXI in 1950 Sample can be measured any time after 1950, and will have the same ratio as 1950 14C/12C Sample made or collected in year T decay correction Time 2008 1950
D (known-age corrected samples ) Corrects for decay of 14C in the sample from the year of growth (x) to 1950) D expresses the radiocarbon signature relative to “Modern” had the sample been measured in 1950. This is useful for studies attempting to show how the radiocarbon signature of air (tree rings) and water (corals) changes with time. It is the basis for creating the calibration curves used to calculate calendar age from radiocarbon age
Past Changes in Atmospheric 14C recorded in tree rings 1950 - T T = known age (years before 1950); l = ln(2)/5730 yr (actual half-life) This is equal to 1/8267yr (we refer to this as the mean life) 1950 Decay correction
Past Changes in Atmospheric D (pre-1950, D = D14C) recorded in tree rings Year BP Note that 8000 yrs ago, 14C was about 10% higher than in 1950; Higher production rates or different distribution of radiocarbon among atmosphere, ocean and land? D (also D14C) of atmosphere Calendar Year If we know the year the sample was formed, we can correct for radiodecay from that year to 1950 to determine what the 14C of the atmosphere was in the past.
Tree-ring calibration curve 14C age The 14C value measured in tree rings of known age is used to determine the 14C value of the atmosphere for the year of tree growth
Calibration curve for radiocarbon ages shows lack of ability to determine differences in calendar ages using 14C in the past ~300 years. Radiocarbon age: 120 +/-50 years Yields calibrated ages of 270-160 and 150-50 years BP (Present is always 1950)