Download
1 / 35
350 likes | 436 Views
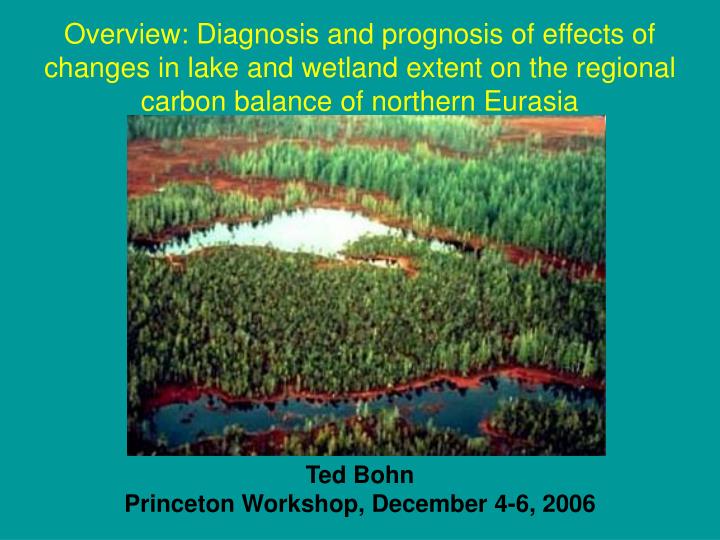
Overview: Diagnosis and prognosis of effects of changes in lake and wetland extent on the regional carbon balance of northern Eurasia. Ted Bohn Princeton Workshop, December 4-6, 2006. Outline. Project Details Motivation Carbon, Water, and Climate High-latitude Wetlands Lakes

E N D
Overview: Diagnosis and prognosis of effects of changes in lake and wetland extent on the regional carbon balance of northern Eurasia Ted Bohn Princeton Workshop, December 4-6, 2006
Outline • Project Details • Motivation • Carbon, Water, and Climate • High-latitude Wetlands • Lakes • Science Questions • Strategies • Modeling • Remote Sensing • Validation: In-Situ Data • Preliminary Results • Future Work (Freeman et al., 2001)
Project Details Part of Northern Eurasia Earth Science Partnership Initiative (NEESPI) Personnel: • PI: • Dennis Lettenmaier (University of Washington, Seattle, WA, USA) • Co-PIs: • Kyle MacDonald (NASA/JPL, Pasadena, CA, USA) • Laura Bowling (Purdue University, Lafayette, IN, USA) • Collaborators: • Gianfranco De Grandi (EU Joint Research Centre, Ispra, Italy) • Reiner Schnur (Max Planck Institut fur Meteorologie, Hamburg, Germany) • Nina Speranskaya and Kirill V. Tsytsenko (State Hydrological Institute, Russia) • Daniil Kozlov and Yury N. Bochkarev (Moscow State University) • Martin Heimann (Max Planck Institut fur Biogeochemie, Jena, Germany) • Ted Bohn (University of Washington, Seattle, WA, USA) • Erika Podest (NASA/JPL, Pasadena, CA, USA) • Ronny Schroeder (NASA/JPL, Pasadena, CA, USA) • KrishnaVeni Sathulur (Purdue University, Lafayette, IN, USA)
NEESPI Region Wetlands Forest Crops Grass/Shrub/Tundra
Carbon, Water, and Climate • Human impact since 1750 • Emissions of 460-480 Gt C (as CO2) • Burning of fossil fuels: 280 Gt C • Land-use change: 180-200 Gt C • Atmosphere’s C pool has only increased by 190 Gt C (~ 40% of emissions) • Land and ocean have taken up the remainder (roughly 150 Gt C, or 30%, each) • Ability of land/ocean to continue absorbing C is limited and depends on climate • Hydrology plays a major role (Keeling et al., 1996)
Terrestrial Carbon Stocks (IPCC 2001) • Wetland soils store the most carbon per unit area • Wetland extent depends on hydrology • Wetland behavior depends on hydrology
High-Latitude Wetlands – Boreal Peatlands • Carbon Sink • cold T & saturated soil for most of year • NPP > Rh and other C losses • 70 TgCyr-1 (Clymo et al 1998) - very uncertain • Current storage: 455 Pg C (1/3 of global soil C, ¼ of global terrestrial C) (Gorham 1991) Dual role in terrestrial carbon cycle • Methane Source • Saturated soil → anaerobic respiration • 46 TgCyr-1 (Gorham 1991; Matthews & Fung 1987) very uncertain • Roughly 10 % of global methane emissions • Methane is a very strong greenhouse gas (Wieder, 2003) • Balance of these effects depends on climate • Climate feedback
Peatland H2O Budget Precipitation (P) Evaporation (E) Transpiration (Tr) Living Biomass Surface Runoff (Qs) Acrotelm To Ocean Water Table Streams From Upslope Subsurface Flow (Qsb) Groundwater Catotelm Water Table = f(P, E, Tr, Qs, Qsb)
Peatland C Budget* (NPP – Rh ≈ 200-300 Tg C/y) CO2 CH4 (45 Tg C/y) CO2 CO2 (25-40 Tg C/y) Fire NPP Living Biomass CO2 (25-50 Tg C/y) Litter Acrotelm Outgassing Aerobic Rh Org C To Ocean Water Table DOC DOC Streams (25 Tg C/y) Anaerobic Rh DOC From Upslope Subsurface Flow (Qsb) Catotelm Carbon balance = f(NPP, T, water table, fire, DOC export) * Extremely crude estimates!
Peatland Distribution in N. Eurasia West Siberian Lowlands Majority of world’s peatlands are in Eurasia (mostly peatlands) • Belt of major peat accumulation overlaps with: • boreal forest (taiga) • permafrost (Gorham, 1991)
High-Latitude Lakes • Accumulate large amounts of carbon • Lakes worldwide accumulate 42 Gt C/yr in their sediments (Dean and Gorham, 1998) • Vent terrestrial carbon to the atmosphere • Respiration > Productivity in most lakes (Kling et al., 1991, Cole et al., 1994) • R:P correlates with DOC (del Giorgio et al., 1994) • DOC is imported from surrounding terrestrial ecosystems (especially true near wetlands) • Some Arctic terrestrial ecosystems may become net sources of atmospheric carbon when DOC loss is taken into account • NE Siberian thaw lakes are strong methane sources (Walter et al., 2006) • Decomposition of “fresh” carbon in newly-thawed soil under lakes • Substantial amounts of C could be liberated as methane if all permafrost were to thaw
Lake H2O Budget Precipitation (P) Evaporation (E) Streams, Surface Runoff, Groundwater Streams To Ocean Balance: P + Qin = E + Qout
Lake C Budget CO2 CO2, CH4 CO2 Dis- solution Evasion NPP Algae Aerobic Rh DOC Streams, Surface Runoff, Groundwater POC DOC POC (~30%) Streams Sediment Deposition To Ocean 42 Gt C/yr Anaerobic Rh Balance: TOCin + NPP = Rh + TOCout
High-Latitudes Have Experienced Change • Increasing precipitation (Serreze et al., 2000) • Increasing river discharge (Peterson et al., 2002) • Growing/shrinking lakes (Smith et al., 2005) • Thawing of permafrost (Turetsky et al., 2002) • Increased outgassing of methane (Walter et al., 2006)
DOC Export • DOC export from Arctic land into Arctic Ocean: 25.1 Tg C/y (Opsahl et al. 1999) • Peatlands supply most of this (Pastor et al. 2003) • Higher DOC in streams can drive outgassing of CO2 (evasion) • Fry and Smith, 2005: • Permafrost zone: DOC export small • Permafrost-free zone: DOC export large (Opsahl et al., 1999)
Main Science Issues • High-latitude lakes and wetlands are potentially large sources of CO2 and CH4 • Fluxes and extent are sensitive to climate (especially hydrology) • Lake/wetland extent is underrepresented by low-resolution remote sensing • Long time series of high-resolution remote sensing data not available
Science Questions • Overarching Science Questions: • How have changes in lake and wetland extent in northern Eurasia over the last half-century affected the region’s carbon balance? • What will the effects be over the next century? • Sub-Topics: • What areas within the region have been/will be affected by changes in lake/wetland extent? • How are ongoing changes in the tundra region affecting the dynamics of wetlands? • Changes in permafrost active layer depth • How are/will these changes affect the carbon balance of the region? • How well can current sensors (MODIS, SAR) detect changes in wetland extent? • Can high-resolution SAR products be used to provide seasonal and interannual variations in lake/wetland extent? • Extend the rapid repeat cycle of lower-resolution products like MODIS
Modeling Strategy Integrate several models: • VIC – hydrology (incl. frozen soil, water table, explicit lake/wetlands model) • BETHY – fast ecosystem processes on sub-daily timescale (photosynthesis, respiration) • Walter-Heimann (WHM) methane model – methane emissions on daily timescale • CH4 flux = f(water table, soil T, NPP) • LPJ – slow ecosystem processes on yearly timescale (change in plant assemblage, fire)
VIC: Large-scale Hydrology • Typically 0.5- to 0.125-degree grid cells • Water and energy balance • Daily or sub-daily timesteps Inputs • Meteorology: • Gridded ERA-40 reanalysis • Soil parameters: • FAO soil properties • Calibration parameters • Soil layer depth • Infiltration • Baseflow • Vegetation parameters: • Observed veg cover fractions (AVHRR) • Veg properties from literature Outputs • Moisture and energy fluxes and states • Hydrograph (after routing) Mosaic of veg tiles; Penman-Monteith ET Heterogeneous infiltration/runoff Non-linear baseflow Multi-layer soil column
VIC Lake/Wetland Algorithm soil saturated land surface runoff enters lake evaporation depletes soil moisture lake recharges soil moisture Lake drainage = f(water depth, calibration parameter)
(Completed) Model Integration Obs Met Data or Climate Model Precipitation, Air temperature, Wind, Radiation Obs or Projected [CO2] • VIC • Hydrology • BETHY • Photosynthesis • Respiration • C storage • LPJ • Species distribution • Fire Soil moisture, evapotranspiration C fluxes Plant functional types Water table, Soil temperature NPP • Walter-Heimann Methane Model • Methane emissions
Validation: Remote Sensing JERS: 100m SAR imagery 1 mosaic, acquired 1997/1998
Validation: In-Situ Data • Landcover classifications: • 5-yearly landcover summaries (SHI) 1950s-1990s • Hydrological observations: • Soil moisture (SHI) 1960s-1980s • Evaporation (pan & actual) (SHI) 1960s-1990s • Carbon fluxes: • TCOS towers (hourly, 1998-2002)
soil moisture soil moisture and T evap flux tower
Preliminary Results Valdai/Fyodorovskoye Sites Ob Site
Carbon Fluxes at Fyodorovskoye Tower Productivity and Respiration g C/m2d Net CO2 Emissions g C/m2d Date
Future Work • Remote Sensing: • Validation of remote sensing classifications • In-situ data • Other remote-sensing products • Extension of classifications back in time via relationships with other remote sensing or in-situ products • Models: • Finish integration of models • Add photosynthesis, respiration, etc. to VIC • Take into account decomposition of carbon formerly locked up in permafrost (specifically: yedoma)? • DOC leaching from terrestrial systems • Take into account C cycling in lakes • Add long-term vegetation dynamics
Future Work • Validate models against historical observations • Landcover timeseries (from remote sensing/in situ data) • Lake extent (seasonal) • Wetland extent • Vegetation cover • Hydrological fluxes and storage • soil moisture and temperature • evaporation • runoff • water table • snow depth and cover • Carbon fluxes and storage • CO2 • CH4 • standing biomass • soil carbon profiles • DOC in soil, streams, lakes • C accumulation rates in soils, lake sediments • Expand from point estimates to regional estimates • Use climate models to predict changes over next century
Thank You (Corradi et al., 2005)
6 g CO2/m2day over next 20 years 1 g CO2/m2day over next 100 years 0 net greenhouse effect over next 149 years Net greenhouse sink thereafter Peatlands: Long-term C Sink butInitial Greenhouse Source • Methane Greenhouse • Warming Potential (GWP): • 62 (20 years) • 23 (100 years) • 7 (500 years) • Compared to CO2, CH4 is • a stronger, but shorter-lived, • greenhouse gas Adding 1 m2 of peatland produces the equivalent CO2 emissions: Removing 1 m2 of peatland is initially a greenhouse sink, then a source Friborg et al., 2003
Modeling Strategy • Previous Studies: • Coarse statistical relationships between soil moisture and methane emissions • Some used explicit ecosystem C-cycling • Some handled frozen soils • None used explicit lake/wetland formulations • Large disagreement on magnitude of future emissions