Download
1 / 12
120 likes | 396 Views
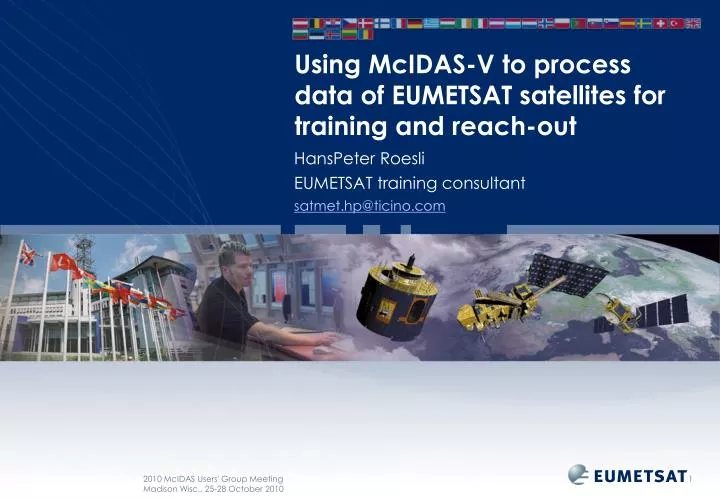
HansPeter Roesli EUMETSAT training consultant satmet.hp@ticino.com. Using McIDAS-V to process data of EUMETSAT satellites for training and reach-out. Plug-in for many MSG/SEVIRI RGB schemes. # Dust # units: K #R: 10-09 -4K..2K #G: 09-07 0K..15K gamma=2.5 #B: 09 261K..289K

E N D
HansPeter Roesli EUMETSAT training consultant satmet.hp@ticino.com Using McIDAS-V to process data of EUMETSAT satellites for training and reach-out
Plug-in for many MSG/SEVIRI RGB schemes # Dust # units: K #R: 10-09 -4K..2K #G: 09-07 0K..15K gamma=2.5 #B: 09 261K..289K def DUST_RGB(ch07,ch09,ch10): img1 = 255*max_data(min_data((ch10-ch09+4)/6,1),0) img2 = 255*max_data(min_data((ch09-ch07)/15,1),0)**(1/2.5) img3 = 255*max_data(min_data((ch10-261)/28,1),0) return combineRGB(img1,img2,img3) automatic channel selection
Dust RGB showing Saharan dust transport dust in pink • Remark: • Only image sequences produced by McIDAS-V – movies always done with freeware tools • Cannot be done conveniently in McIDAS-V – map bundle inherits width/height from current display window (and not from bundle) → IDV
Dust RGB applied to MODIS channels dust in pink
Mining many features – semi-transparent split-window difference over Airmass RGB Input through • local ADDE server (LOCAL-DATA): • MSG HRIT FD • MSG HRIT HRV • remote ADDE servers Airmass RGB • 3D-cloud map • Bluish hues map polar air • Greenish hues map sub/tropical air • Reddish hues map dry upper troposphere (stratospheric intrusions, PV maxima) Split-window difference • Ash from Eyjafjalla eruption as tracer of a deformation zone
Match-up of volcanic ash & SO2 RGB and Metop-A instruments IASI Input and display with HYDRA functionalities B/W image of a channel difference sensitive to SO2 GOME-2 • Input of SO2 maps in equirectangularlatlon projection (“World”) SO2 in greenish hues on RGBs
Sensitivity comparison AVHRR/MODIS Input through local ADDE servers (LOCAL-DATA): • Metop AVHRR 1b • MODIS MOD 02 ...
An exotic event – SEVIRI documents asteroid impact Exotic event – SEVIRI documents asteroid impact visible flash calculated track and observation of flash and IR signal from debris cloud track shift due to parallax • Initial flash and debris cloud after sunrise in red • Debris cloud before sunrise in black to cyan
NWP fields and cold cloud tops – Hajj storm no particular forcing middle/upper troposphere low-level jet over Red Sea
Image averaging – detecting persistent cloud • 100-day average of local-noon images reveals a persistent low cloud deck along the southern coast of the Arabian Peninsula during the monsoon season over the Arabian Sea • Phenomenon is known as the welcome Al Khareef season in the seaport of Salalah • ... and land turns green
Temperature maximum – simple de-clouding after 3 night over the Amazonas basin after 6 night over Africa Extracting the maximum temperature from nightly IR time series de-clouds the scene revealing land features like water bodies or temporarily flooded areas
Monitoring weather and climate from space EUMETSAT THANK YOU