Download
1 / 26
260 likes | 460 Views
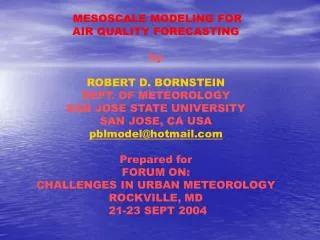
Prof. Robert Bornstein Dept. of Meteorology, San Jose State University pblmodel@hotmail.com Prof. Jorge Gonzalez and Bereket Lebassi Dept. of Mechanical Engineering, Santa Clara U. Presented at the AGU Fall Meeting San Francisco, CA 15-19 Dec. 2008.

E N D
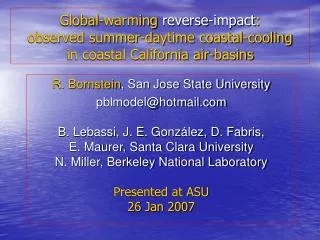
Prof. Robert Bornstein Dept. of Meteorology, San Jose State University pblmodel@hotmail.com Prof. Jorge Gonzalez and Bereket Lebassi Dept. of Mechanical Engineering, Santa Clara U. Presented at the AGU Fall Meeting San Francisco, CA 15-19 Dec. 2008 Observations of Cooling Summer Daytime Temperatures (1948-2005) in GrowingUrban Coastal California Air Basins
Background • Global & CA observations generallyshow • asymmetric warming (more warming for Tmin than for Tmax) • acceleration since mid-1970s • CA downscaled global-modeling (see graph) • done (at SCU & elsewhere) onto 10 km grids • shows summer warming that decreases towards the coast (but does not show coastal cooling)
Statistically down-scaled (Prof. Maurer, SCU) 1950-2000 annual summer (JJA) temp-changes (0C) show warming rates that decrease towards coast, where red dots are COOP sites used in present study & boxes are study sub-areas
Previous CA Climate-change studies (next 2 slides) have explained their obsin terms of increased: • Coastal upwelling (Bakum ‘90) • SSTs & urbanization (Goodridge ‘91) • Cloud cover (Nemani et al. ’01) • Irrigation (Christy et al. ’06, Bonfils & Duffy ’07, Lobell & Bonfils et al. ‘08)
Current Hypothesis INCREASED GHG-INDUCED INLAND TEMPS INCREASED (COAST TO INLAND) PRESSURE & TEMP GRADIENTS INCREASED SEA BREEZE FREQ, INTENSITY, PENETRATION, &/OR DURATION COASTAL AREAS SHOULD SHOW COOLING SUMMER DAYTIME MAX TEMPS (i.e., A REVERSE REACTION) NOTES: • NOT TOTALLY NEW IDEA • NEW WORK TO APPEAR IN J. OF CLIMATE
CURRENT DATA • NCDC DAILY MAX & MIN 2-METER TEMPS • FROM ABOUT 300 CA NWS COOP SITES • FOR 1948-2005 • USED IN MANY OTHER CA CLIMATE-CHANGE STUDIES • ERA40 1.4 DEG T-85 REANALYSIS JJA 1000-LST • SEA-LEVEL PRESSURE TRENDS • FOR 1970-2005
Results 1: SoCAB 1970-2005 summer (JJA) Tmax warming/ cooling trends (0C/decade); solid, crossed, & open circles show stat p-values < 0.01, 0.05, & not significant, respectively ? ? ?
Results 2: SFBA & CV 1970-2005 JJA Tmax warming/cooling trends (0C/decade), as in previous figure ? ? ?
Results 3: JJA Temp trends; all CA-sites • LOWER TRENDS FROM 1950- 70 (EXCEPT FOR TMAX) • Curve b: TMIN HAD FASTEST RISE (AS EXPECTED) • Curve c: TMAX HAD SLOWEST RISE; IT IS A SMALL-∆ B/T BIG POS VALUE & BIG NEG-VALUE (AS IN ABOVE 2 GRAPHS) • CURVE a:TAVE THUS ROSE AT MID RATE • Curve d: DTR THUS • DECREASED (AS TMAXFALLS & TMIN RISES)
Significance of These all-CA Trends • HIGHER TRENDS FROM 1970-2005 FOCUS NEEDED ON THIS PERIOD • TMINHAS FASTER RISE ASSYMETRIC WARMING IN LITERATURE • TMAX HAS SLOWER RISE, BECAUSE IT IS A SMALL DIFFERENCE B/T BIG POS-VALUE & BIG NEG-VALUE (AS SEEN IN SPATIAL PLOTS) • TAVE & DTR ARE ALSO THUS “CONTAMINATED” • NEXT 2 SLIDES THUS SHOW SEPARATE ANALYSES OF CA COASTAL AND INLAND AREAS
Result 4: JJA Tave, Tmin, Tmax, & DTR TRENDS FOR INLAND-WARMING SITES OF SoCAB & SFBA a Curve b: TMIN INCREASED (EXPECTED) Curve c: TMAX HAD FASTER RISE; (UNEXPECTED), COULD BE DUE TO INCREASED UHIs CURVE a:TAVETHUS ROSE AT MID RATE Curve d: DTR THUS INCREASED (AS TMAX ROSE FASTER THAN TMIN ROSE b c d
Result 5: JJA Tave, Tmin, Tmax, & DTR TRENDS FOR COASTAL-COOLING SITES OF SoCAB & SFBA a Curve b: TMINROSE (EXPECTED) Curve c: TMAX HAD COOL-ING (UNEXPECTED MAJOR RESULT OF STUDY) CURVE a:TAVE THUS SHOWED ALMOST NO CHANGE, AS FOUND IN LIT.), AS RISING Tmin & FALLING Tmax CHANGES ALMOST CANCELLED OUT Curve d: DTR THUS DE-CREASED, AS TMIN ROSE & TMAX FELL b c d
Significance of These Coastal-Cooling and Inland-Warming Trends • CA ASSYMETRIC WARMING IN LITERATURE IS HEREIN SHOWN TO BE DUE TO CONCURRENT COOLING TMAX IN COASTAL AREAS & WARMING TMAX IN INLAND AREAS • PREVIOUS CA STUDIES • THAT DID NOT LOOK SPECIFICALLY AT SUMMER DAYTIME COASTAL VS. INLAND VALUES HAVE THUS REPORTED CONTAMINATED TMAX, TAVE, & DTR VALUES • HOWEVER, ARE NOT INCONSISTENT WITH CURRENT RESULTS, THEY ARE JUST NOT AS DETAILED IN THEIR ANALYSES AND THEIR RESULTS
Trend in 1979-2002 ERA40 reanalysis of 1800 UTC (1000 LT) JJA sea-level p-changes (hPa/decade) • dots =1.4-deg grids • end-pts of solid lines = pts for p-grad trend calcu-lation (next slide) • H & L: strength-ened & moved to NW (can’t see in this slide)
Result 6: Trends in sea minus land JJA 1800 UTC sea-level p- gradient (hPa/100-km/decade) from values at ends of lines in prev. Fig. Key: SFBA (red) SoCAB (blue) These stronger HPGFs stronger sea breezes coastal cooling
Result 7. JJA 1970-2005 2 m max-T trends for 4 pairs of urban (red, solid) & rural (blue, dashed) sites • Notes: • All sites are near the cooling-warming border • UHI-TREND = absolute sum b/t warming-urban & cooling-rural trends (K/decade) • 3. SFBA sites • Stockton (0.55) • Sac. (0.51) • 4. SoCAB sites • (c) Pasadena (0.26) • (d) S. Ana (0.12)
Notes on JJA daytime UHI-trend results • The fastest growing cities had the fastest growing UHIs • As no coastal sites showed warming T-max values, the calculation could only be done at these four pairs, located at the inland boundary b/t the warming and cooling areas • The coastal sites would have cooled even more w/o their (assumed) growing UHIs
BENEFICIAL IMPLICATIONS OF COASTAL COOLING • NAPA WINE AREAS MAY NOT GO EXTINCT (REALLY GOOD NEWS!); SEE MAP • LOWER HUMAN HEAT-STRESS RATES • OZONE CONCENTRATIONS MIGHT CONTINUE TO DECREASE, AS LOWER MAX-TEMPS REDUCE • ANTHROPOGENIC EMISSIONS • BIOGENIC EMISSIONS • PHOTOLYSIS RATES • ENERGY FOR COOLING MAY NOT INCREASE AS RAPIDLY AS POPULATION (NEXT GRAPH)
NAPA WINE AREAS MAY NOT GO EXTINCT DUE TO ALLEGED RISING TMAX VALUES, AS PREDICTED IN NAS STUDY
Result 6: Peak-Summer Per-capita Electricity-Trends • Down-trend at cooling Coastal: LA (blue) & Pasadena (pink, 8.5%/decade) > Up-trend at warming inland Riverside(green) • Up-trend at warming Sac & Santa Clara Need: • detailed energy-use data for more sites • to consider changed energy efficiency
POSSIBLE FUTURE EFFORTS (PART 1 OF 2) • EXPAND (TO ALL OF CA) • ANALYSIS OFOBS (IN-SITU & GIS) • URBANIZED MESO-MET (MM5, RAMS, WRF) MODELING • SEPARATE INFLUENCES OF CHANGING: • LAND-USE PATTERNS RE • AGRICULTURAL IRRIGATION • URBANIZATION & UHI-MAGNITUDE • SEA BREEZE: INTENSITY, FREQ, DURATION, &/OR PENETRATION • DETERMINE POSSIBLE “SATURATION” OF SEA- BREEZE EFFECTS FROM • FLOW-VELOCITY & COLD-AIR TRANSPORT • AND/OR STRATUS-CLOUD EFFECTS ON LONG- & SHORT-WAVE RADIATION
POSSIBLE FUTURE EFFORTS (PART 2 OF 2) • DETERMINE CUMULATIVE FREQ DISTRIBU-TIONS OF MAX-TEMP VALUES, AS • EVEN IF AVERAGE MAX-VALUES DECREASE, • EXTREME MAX-VALUES MAY STILL INCREASE (IN INTENSITY AND/OR FREQUENCY) • DETERMINE CHANGES IN LARGE-SCALE ATMOSPHERIC FLOWS: • HOW DOES GLOBAL CLIMATE-CHANGE EFFECT POSIT-ION & STRENGTH OF: PACIFIC HIGH & THERMAL LOW? • THIS IS ULTIMATE CAUSE OF CLIMATE-CHANGE