Download

1 / 12
120 likes | 262 Views
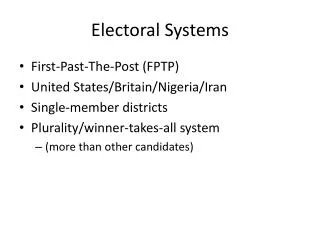
Electoral Systems. Evaluations of electoral systems. Fairness = Proportionality? California statewide vote for seats in the House of Representatives: 43% R 54% D California distribution of seats in the House of Representatives: 38% R 62% D. Evaluations of electoral systems.

E N D
Evaluations of electoral systems • Fairness = Proportionality? • California statewide vote for seats in the House of Representatives: 43% R 54% D • California distribution of seats in the House of Representatives: 38% R 62% D
Evaluations of electoral systems • Level of satisfaction? Number of losers? • Fairness = Proportionality? • Representation • Simplicity
How do electoral systems affect the behavior of candidates and voters? • Party systems • “Duverger’s Law”: The more proportional the system, the greater the number of “effective” political parties there will be.
Why Duverger’s Law • Mechanically • Psychologically (candidates) • Psychologically (voters)
How do electoral systems affect the behavior of candidates and voters? • Party systems • Party organization • Election campaigns
The American System • Seats not allocated proportionally • Constituency based representation • Simple ballot choices • Two large coalitional parties • Decentralized parties • Decentralized campaigns
Median Voter Theorem • Assumptions: • Single dimensional issue space • Pairwise vote • Voters always vote (no abstentions) • Voters have one unique preferred position • Voters’ preferences “single peaked” • Parties/candidates maximize chances of winning • Preferences are normally distributed in electorate
Median Voter Theorem • If all voters vote and their preferences are single-peaked and on a single dimension, then the median ideal preference can defeat all other positions in a pairwise vote.