Download
1 / 41
460 likes | 736 Views
Environment Assessment Programme for Asia and the Pacific. Forest Fires (Indofire). Forest Fire. TYPES OF FOREST FIRES 1. Underground Fire Consumes organic material beneath the surface (peat swamps, coal seams) 2. Surface Fires Burn surface litter, loose debris of

E N D
Environment Assessment Programme for Asia and the Pacific Forest Fires (Indofire)
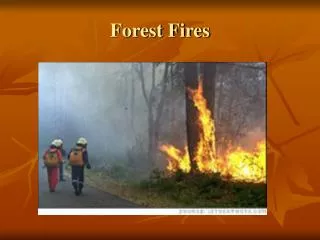
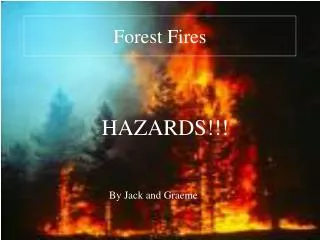
Forest Fire TYPES OF FOREST FIRES 1. Underground Fire Consumes organic material beneath the surface (peat swamps, coal seams) 2. Surface Fires Burn surface litter, loose debris of forest floor (common in tropical forests) 3. Crown Fire Consumes upper branches and foliage (common in pine forests) WHAT IS IT? “A forest fire is defined as any fire in forest land which is not being used as a tool in forest protection or management in accordance with an authorized plan.” (SAF, 1964) UNEP EAP.AP
Causes NATURAL FACTORS • Weather phenomena (drought, El Nino, lightning) • Vegetation type (fuel types) MAN MADE FACTORS • Slash and burn agricultural practice • Land clearing practice using fire • Farmers burn forest to get high yield • Grazing land management by using fire • Fires by accident (hunting, campsites) UNEP EAP.AP
Impact and Damages Land • Loss of agricultural/plantation crops • Destruction of forest land • Loss of grazing land • Loss of soil properties Water • Pollution of surface water • Pollution of underground water Air • Pollution due to haze/smog • Loss of visibility • Generation of greenhouse gas Human Health • Increase of smoke-induced respiratory diseases • Loss of human life Economy • Loss in trade of forest products • Loss of government revenue • Cancellation of flights/ships • Loss of income from tourism Biodiversity • Reduction of sunlight • Loss of medicinal plants • Loss of endangered species UNEP EAP.AP
Needs for Prevention 1. Fire Hazard Reduction • Identification of potential risk areas • Construction of fire breaks • Felling of dead trees • Make people aware of the risk areas 2. Fire Detection • Detection through observation, lookout-towers • Aerial detection (aircrafts) • Infrared scanner • Remote sensing data 3. Fire Suppression • Use of hand tools, pumps, hose • Aircraft bombardments • Air-borne tankers • Use of chemicals UNEP EAP.AP
INDONESIA Sources of Forest Fire, 1997 UNEP EAP.AP
INDONESIA Indonesia Forest Fires and Extent of Smog, 1997 UNEP EAP.AP
INDONESIA Forest Fires, 1997 SOURCE: WORLD WILDLIFE FUND UNEP EAP.AP
INDONESIA 300000 250000 200000 150000 Area in hectares 100000 50000 0 1985 1984 1986 1987 1988 1989 1990 1991 1992 1993 1994 1995 1996 1997 Forest Fires, 1984-1997 El Niño Years UNEP EAP.AP
INDONESIA FOREST FUNCTION AREA (Hectares) PERCENTAGE(%) Protection Forest 21,962.74 8.319 Production Forest 163,443.97 61.913 Nature Reserves 17,238.16 6.530 Recreation Parks 1,415.50 0.536 National Parks 54,331.13 20.582 Grand Forest Parks 652.63 0.240 Research Forest 4,740.58 1.800 Urban Forest 5.00 0.003 Hunting Reserves 201.50 0.077 TOTAL 263,991.21 100.000 Forest Fires by Function, 1997 Source: Ditjen Perlindungan Hutan dan Pelestarian Alam, 1998 UNEP EAP.AP
INDONESIA Assessment of Forest Fire Hazard in Indonesia, 1997-98 Resource Impact Loss/Magnitude Remarks Land Total area burned 5 million hectares Includes forest, Forest area burned 1 million hectares agriculture land Agricultural/Plantation 2.5 million hectares Plantations include Others (unproductive) 1.5 million hectares Palm oil & Rubber Water Pollution of Surface Water Yet to be estimated Pollution of Ground Water Air Air Pollution due to haze API= 839 (Sarawak) API 100-200 : Unhealthy and smog 201-300 : Very U/h (Smog covered up to 301-500 : Hazard 3,200 km in 6 countries) Air Quality (SO2, NOx, AQ 120 CO, SPM)= 700 micrograms/meter3 micrograms/m3 (Normal) Visibility < 15 meter Visibility 1000 meter (Normal) UNEP EAP.AP
INDONESIA (Air Quality in Various Fire Locations) August-September 1997 PROVINCES TOTAL DUST (g/m3) SO2(g/m3) NOX(g/m3) CO (g/m3) 24 Hours 3 Hours N. Sumatra 1,600-1,900 480-570 0.05-0.08 0.04-0.12 9.2-16.0 W. Sumatra 330-350 99-105 0.00-0.08 Ttd - Riaui 1,500-2,040 450-612 20.1-181.3 10.2-40.9 - Jambi 862-2,866 259-860 - 6.3-21.822.9-30.9 S. Sumatra 2,700 810 0.15 - - W. Kalimantan 950-2,300 285-690 - - - C. Kalimantan 1,310-2,790 393-837817-1,266186.5 1.7 S. Kalimantan 430 129 0.15 0.03 6.9-12.6 Critical Threshold 260 260 92.5 23 - Source: MoH Remarks: Ttd = Undetectable Italic Points show the figure has exceeded the critical threshold UNEP EAP.AP
INDONESIA Assessment of Forest Fire Hazard in Indonesia, 1997-98 Resource Impact Loss/Magnitude Remarks Human Health People suffered from smoke- 70 million affected Increased no. patients prone to Asthma, induced respiratory prob. 40,000 hospitalized Bronchitis,eye infection,etc.. Indonesian Airbus Crashed 234 passengers died Due to low visibility 2 ships collided 38 people died Indonesian Police 3 people died No. of deaths reported 262 people Economy Total loss US$ 4.5 billion (WWF Study) Forestry Companies loss US $12.5 million Cancellation of 3,372 flights US $ 6 million loss Effect on Tourism due to low visibility Factories, schools and Loss in trade and offices were closed business Loss of Income from tourism US $26 billion/year Sharp decline in revenues UNEP EAP.AP
INDONESIA Assessment of Forest Fire Hazard in Indonesia, 1997-98 FIRE-RELATED DAMAGES (IN USD MILLIONS) Type of Loss Lost to Indonesia Lost to other Total Countries Timber 493.7 ---- 493.7 Agriculture 470.4 ---- 470.4 Direct Forest Benefits 705.0 ---- 705.0 Indirect Forest Benefits 1077.1 ---- 1077.1 Capturable Biodiversity 30.0 ---- 30.0 Fire Fighting Cost 11.7 13.4 25.1 Carbon Release ---- 272.1 272.1 TOTAL FIRE 2787.9 285.5 3073.4 HAZE-RELATED DAMAGES (IN USD MILLIONS) Short term health 924.0 16.8 940.8 Tourism 70.4 185.8 256.2 Other 17.6 181.5 199.1 TOTAL 1012.0 384.1 1396.1 TOTAL FIRE & HAZE 3799.9 (85%) 669.6 (15%) 4469.5 (Study undertaken by WWF-Indonesia & EEPSEA, May 1998) UNEP EAP.AP
INDONESIA (Haze Related Health Cases) PROVINCES NO. OF EXPOSED NUMBER OF CASES POPULATION DEATH ASTHMA BRONCHITIS ARI Riau 1,701,000 75 41,028 7,995 199,017 W. Sumatra 2,411,000 106 58,154 11,332 282,087 Jambi 1,478,000 65 35,650 6,947 172,926 S. Sumatra 2,355,000 104 56,803 11,069 275,535 W. Kalimantan 1,848,000 74 44,574 8,686 216,216 C. Kalimantan 716,000 29 17,270 3,366 83,772 S. Kalimantan 1,733,000 69 41,800 8,145 202,761 E. Kalimantan 118,000 5 2,846 555 13,806 TOTAL 12,360,000 527 298,125 58,095 1,446,120 September-November 1997 Source: Report on Forest and Land Fires in Indonesia - Impacts, Factors and Evaluation Volume 1, September 1998 / State Ministry for Environmental Republic of Indonesia and UNDP UNEP EAP.AP
INDONESIA Assessment of Forest Fire Hazard in Indonesia, 1997-98 Resource Impact Loss/Magnitude Remarks Bio-diversity 20% reduction in Sunlight 60C Temp. lowered Will affect fungi in the Loss from the normal soil that promote new growth Medicinal Species affected 100 no.s Animals affected by blazes 30 female Orangutans Only 25,000 Orangutans (elephants, bears died exist in the world Sumatran tigers, snakes, birds, Orangutans) 30,000 long-limbed apes in Kalimantan face serious threat 100-200 Sumatran 60 Javan Rhinos are Rhinos face problem the rarest Rhino in Asia 1800 elephants in danger of starvation in Sumatra UNEP EAP.AP
NOAA Satellite Data INDONESIA / MALAYSIA ASMC (automated data processing) INTRANET hot spots Aerial Surveillance Ground Survey Fire Suppression Existing Early Detection/Monitoring System UNEP EAP.AP
Notes from Third Working Group Meeting on RFA (16 July 1998) ? • NOAA DATA CHARACTERISTICS • Resolution - 1.1 Km. • Revisit Cycle - 4 times/day PROBLEMS ENCOUNTERED • Need of coordinates of ‘hot spots’ (3 RFA, 16 July 1998) • NOAA for general monitoring, not early detection (4th AMMH, 18-19 June 1998, Singapore) UNEP EAP.AP
Enhanced Early Detection and Monitoring System ASMC (automated data processing) INTRANET INDONESIA / MALAYSIA NOAA Satellite Data hot spots Aerial Surveillance N E W S Ground Survey Fire Suppression CONFIRMED COORDINATES Acquisition of high resolution satellite data UNEP EAP.AP
NOAA AVHRR IMAGE OVER BORNEO UNEP EAP.AP
Strait of Malacca Borneo Sumatra Smoke Indian Ocean Java Sea 21 October 1997 / 2:53:32 P.M. NOAA AVHRR UNEP EAP.AP
NOAA AVHRR - Zoom 21 October 1997 2:53:32 P.M. Sumatra, Indonesia UNEP EAP.AP
Strait of Malacca Sumatra Borneo Joshi Sumatra Selata Indian Ocean Java Sea 21 October 1997 / 9:47:00 A.M. Landsat UNEP EAP.AP
LANDSAT - Zoom River Smoke Active Fire Location: Long. 102o59’57”E Lat. -2o35’12”S Burned Areas Plantation Area Smoke 21 October 1997 UNEP EAP.AP
LANDSAT - Zoom 21 October 1997 Smoke Burned Areas Smoke Smoke Active Fire Location: Long. 103o01’29”E Lat. -2o37’35”S UNEP EAP.AP
LANDSAT - Zoom 21 October 1997 Active Fire Location: Long. 103o01’31”E Lat. -2o47’46”S Burned Areas Smoke UNEP EAP.AP
1 March 1998 / 10:38:58 A.M. River SPOT Forest UNEP EAP.AP
SPOT - Zoom 1 March 1998 Smoke Origin of Forest fire Smoke Plantation Area Burned Area UNEP EAP.AP
SPOT - Zoom 1 March 1998 Origin of Forest fires Smoke Smoke UNEP EAP.AP
ERS-2 ATSR Image over Sumatra 30 September 1997 Hot Spots UNEP EAP.AP
DMSP* Image over Indonesia September 25, 1997 Fire Source: NOAA/NESDIS/NGDC * Defence Meteorological Satellite Program, USA UNEP EAP.AP
Dense Forest Reservoir Cloud River IRS / Date of Pass: 07 January 1996 UNEP EAP.AP
Aerial Surveillance • Can be equipped with a High Resolution Infra-red Scanner or Multi-spectoral Scanner • The data can be used for other purposes, as well Origin of Forest fires Airborne Infra-red Technology Resolution: 3.8m Scale: 1:1000 Area Coverage: 5,887 km2/day Cost: US$10,000/day Example of infra-red picture of fire (Transasia Aerial Consulting Inc. Ltd.) UNEP EAP.AP
A (103 degree 11'38"E, 0 degree 24'17"N) B (103 degree 9'52"E, 0 degree 21'34"N) C (103 degree 8'49"E, 0 degree 21'5"N) D (103 degree 4'25"E, 0 degree 16'11"N) E (103 degree 3'1"E, 0 degree 13'21"N) F (103 degree 3'18"E, 0 degree 6'40"N) G (103 degree 2'26"E, 0 degree 5'6"N)
Satellite Resolution Revisit Area Cost Cycle Coverage (per scene) Landsat 30 meter 16 days 34,225 km2 US$ 4,200 SPOT 10, 20m. 1-3, 26 days 3,600 km2 US$ 2,500 IRS 5.8, 23m. 5, 24 days 4,900 km2 US$ 3,200 Radarsat 10-55m. 24 days 2,025 km2 N/A JERS 18, 24m. 44 days 5,625 km2 US$ 200 ERS 30m. 35 days 10,000 km2 US$ 1,500 Examples of High Resolution Satellite Data • Data can be acquired through satellite programming UNEP EAP.AP
Suggested Steps for One Province Together with designated Center complete a pilot module: a) Selection of a priority province b) Prepare (collect) Baseline GIS database c) Prepare fire hazard maps d) Prepare fire simulation modeling e) Provide Training, Hardware, Software Support UNEP EAP.AP
Proposed Activities PHASE I • Help get high resolution data to ASMC • Train ASMC professionals in handling high resolution satellite data • Hard ware/Software support to ASMC PHASE II • Assist ASMC in providing training to Indonesian counterparts in handling NOAA and high resolution satellite data • Hard ware/Soft ware support to Indonesia UNEP EAP.AP