Download
1 / 43
430 likes | 559 Views
Measurement of sin 2 2 q 13 at the Braidwood Nuclear Reactors Jonathan Link Columbia University Research Techniques Seminar April 13, 2005. Sin 2 2 θ 13 Reactor Experiment Basics. ν e. ν e. ν e. ν e. ν e. ν e. sin 2 2 θ 13.

E N D
Measurement of sin22q13 at the Braidwood Nuclear Reactors Jonathan Link Columbia University Research Techniques Seminar April 13, 2005
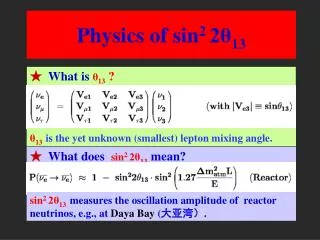
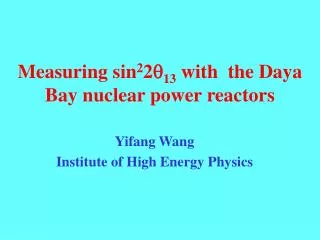
Sin22θ13 Reactor Experiment Basics νe νe νe νe νe νe sin22θ13 Well understood, isotropic source of electron anti-neutrinos Oscillations observed as a deficit of νe Eν≤ 8 MeV 1.0 Unoscillated flux observed here Probability νe Survival Probability Distance 1200 to 1800 meters
Reactor Neutrino Event Signature The reaction process is inverse β-decay Two part coincidence signal is crucial for background reduction Minimum energy for the primary event is1.022 MeV from e+e− annihilation. Positron energy spectrum implies the neutrino spectrum The scintillator is doped with gadolinium to enhance capture Capture can also occur on hydrogen (or carbon, rarely) nep→ e+n ncapture (prompt) (delayed) Eν = Ee + 0.8 MeV nmGd → m+1Gdg’s (8 MeV) nH → Dg (2.2 MeV)
Braidwood Nuclear Station Located about 30 miles due south of the Lab. Operated by Exelon Nuclear. • 2 Reactors with 7.17 GW thermal power • Well understood/favorable geology • Plant construction data • Site investigation (completed Jan. 05) • Strong support from owner • Ability to optimize layout Far Detector Near Detector
Baseline Design: Detectors • Two zone design • 2.6 meter target radius • 3.5 meter total radius • 65 ton target • 1000 PMT’s (coverage>25%) • 0.2% Gd Loaded Scintillator 2.6 m 3.5 m More…
Benefits of Gd Loading Gd has a huge neutron capture cross section → faster capture times and smaller spatial separation. Helps to reduce random coincidence backgrounds. No Gd: 6.1 cm mean 0.2% Gd: 4.3 cm mean No Gd: 142 μs mean 0.2% Gd: 15 μs mean 8 MeV capture energy (compared to 2.2 MeV on H) is distinct from positron energy and rare as radioactive background. More…
Baseline Design: Site Layout • Near detectors at a baseline of 286 meters (~4400 int/day) • Far detectors at a baseline of 1511 meters (~160 int/day) • All detector at a depth of 183 meters (600 ft) • Earth shielding is flat with an average cover of 464 mwe (as measured by our borehole investigation) • This should be compared to ~700 mwe cover under a mountain!
Sensitivity Drivers • There are four main sensitivity drivers… • Neutrino interaction statistics • Near/Far detector relative normalization • Backgrounds • Detector baseline (varies with Δm2) • We will look at each of these in turn. The first 3 are easily translated into measurement errors…
Simple Sensitivity Model < 1– 3σRmeans an effect is observed Where N is the number of observed signal events, L is the baseline and ε is the relative efficiency (≈1). Then… Where… Relative Normalization Statistics Background
Statistics Top 30 U.S. Sites by Power Performance • Ways to optimize statistics… • Reactor power • Braidwood is third most powerful in US • Detector mass • 130 ton baseline design • Planned upgrade to 260 tons • Run time • Straight clock time (3 years initial plus 5 years upgrade) • Reactor uptime (>92% at Braidwood) • Reduced dead time • Check assumptions about optimal baseline with respect to statistical error.
Relative Normalization • The use of a near detector eliminates the normalization uncertainty due to • reaction cross section • neutrino production in the core • reactor power • Truly identical detectors would eliminate the remaining sources of normalization uncertainty which are • detector efficiency • gadolinium fraction (neutron detection efficiency) • target mass • target chemistry: free proton (target particle) fraction • The last three are best measured with detector cross calibration. I won’t discuss these further
Relative Normalization II • Relative detector efficiency can be measured by calibrating all detectors with the same long lifetime radioactive sources. • Gd fraction can be measured by looking at Gd to H capture ratio (statistical precision to better that 0.05%). • Also, control chemistry during detector filling • Relative free proton count (target mass and H fraction) can be controlled by measuring flow rates and equally splitting scintillator batches during detector filling. • It can only be measured by detector cross calibration with neutrinos… • Requiring Movable Detectors!
Movable Detectors Spending just 8% of the run on head-to-head calibration results in a free proton calibration precision of better than 0.3%. Detector calibration techniques can be verified against head-to-head neutrino relative calibration. Detectors can be built during shaft civil construction and commissioned in the near hall while the far hall is still under construction. Detectors can be filled simultaneously and in the same location from the common scintillator batches. More…
Relative Normalization: Final Word Double CHOOZ hopes to achieve 0.6% (or better) relative normalization with fixed detectors. With four detectors there are three independent relative normalizations. So even if this is the best we could do on each pair of detectors the effective relative normalization error is An effective relative normalization error of 0.2% or better is very likely.
Background The vast majority of backgrounds are directly related to cosmic rays (cosmogenic). • There are three types of background • Random coincidence ─ where two unrelated events happen close together is space and time. • Fast neutron ─ where a fast neutron enters the detector, creates a prompt signal, thermalizes and is captured. • βn decays of spallation isotopes ─ isotopes such as 9Li and 8He with βn decay modes can be created in a spallation with μ on 12C. The background rejection methods are the source of dead time in the detector.
Background Notes • The Collaboration is developing comprehensive simulation tools. • In the mean time background calculations are done with a combination of • Hand calculations • Numerical integration of functions (i.e. surface μ spectrum, μ attanuation in rock) • Published data tables • Simple geometries in accepted simulation tools (MARS, Fluka and Geant4) • The Minos near hall, with similar flat overburden, may allow us to test the validity of these calculation techniques.
Cosmic Rays and Related Background Surface spectrum from Gaisser μ attenuation from Groom, Mokhov & Striganov Neutron production model from Wang et al. /m2/s/GeV Isotope production from Hagner et al. 4.5 Hz of μ in target and 21 Hz in veto system
Random Coincidence Background The rate of single events is shown on the left. One can integrate this plot in the positron and neutron signal regions to get the respective random rates. 142k/det/day “positrons” 5070/det/day “neutrons” Assuming KamLAND concentrations of 40K, 232Th and 238U and 450 mwe Plot made by Hannah Newfield-Plunkett The random coincidence of these events in 100 μs window in the right order is 0.4/detector/day. There is no tag for these events → No dead time. Reverse order events give a handle on the background rate
Fast Neutron Background There are three main processes for the prompt “positron-like” events • Two neutron captures from the same cosmic ─ This should be tagged the vast majority of the time, but it sets the tag window for tagged muons at 100 μs. • Proton recoil off fast neutron ─ dominate effect. • Fast neutron excitation of 12C ─ interesting, but not significantly different than 2. Energy spectrum peaks at particular values (like 4.4 MeV, first excited state)
Veto Detectors p n n m m Tagging Muons at Braidwood The basic idea is to tag muons that pass near the detector so that we can reject the fast neutron background. Neutrons from farther away should mostly be ranged out. The Collaboration is considering two options for veto system Shielding • An integrated veto shield ─ 2 meters of liquid scintillator • 1 meter of heavy concrete with surface detectors (RPCs?) 6 meters
Fast Neutron Background in Braidwood • What eludes the tagging system? • Veto inefficiency ─ muon gets inside the veto but is not seen by either the veto or the detector. Need very efficient veto detector. You get two shoots at each muon: entering and exiting. (99% efficiency → 0.25/detector/day) • Fast neutron created outside the shielding ─ calculation follows…
Fast Neutron Background in Braidwood II Using the MARS simulation package I calculate that 2087 neutrons/day will exit the rock on a collision course with the detector target. Of these 0.93% survive 1 meter heavy concrete+90 cm mineral oil and 20% of those have “positron-like” prompt event in the detector. 4 background events In 88% of the original 2087 neutrons, the parent muon passed through the veto at some point. 0.5/detector/day Problematic neutrons are more likely to be vetoed because the colinearity of the parent and daughter is more likely for the fast neutrons that survive the shielding.
Fast Neutron Dead Time The cosmic ray rate in the veto (generously assuming 100 m2 veto area) is 21 Hz and the tag window is 100 μs… 0.2% dead time
Correlated Decay of Spallation Isotopes τ½ = 178 ms 49.5% Correlated τ½ = 119 ms 16% Correlated Correlated final state: β+n+2α Correlated final state: β+n+7Li Used Birks’ law to quench alphas and protons with Birks constant of 0.015 cm/MeV (from Borexino PLB 525, 29).
Correlated Spallation Isotopes in KamLAND KamLAND tagged correlated events closely associated with cosmic muons. Their data is consistent with 9Li being the dominate source of correlated spallation isotope. from the thesis of Kevin McKinny
Correlated Spallation Isotopes KamLAND/Braidwood 9Li Events vs. Minimum Shower Energy μEnergy Loss Due to Ionization ~46 events at threshold of 0. Kevin McKinny’s Thesis Scaling from KamLAND, a 1.5 GeV shower tag in Braidwood would capture ~85% of all 9Li. A 0.5 second tag window would capture >85% of the decays. So this tag would isolate ~72% of all 9Li.
Correlated Spallation Isotopes in Braidwood Expect 0.078 9Li/ton/day, half decay in βn modes, 72% are tagged → 0.7/detector/day. From a simulation of muon energy loss in the Braidwood detector (based on Groom, Mokhov & Striganov + ref. therein) Only 3% fail E cut of <1.5 GeV μ energy loss in 2.6 m sphere of scintillator. With 4.5 Hz of μ and 3% tagged at 0.5 seconds → ~7% dead time Can use neutron captures following cosmic as an additional tag.
Background Summary This is where we stand today with conservative assumptions. Compare to 160 signal/detector/day at the far site (S/N~85) With a 10-20% uncertainty in the BG rate, sensitivity to sin22θ13 in the simple model is 0.01 (90% CL) at Δm2=2.5×10⁻³.
Energy Spectrum Fit Fitting the energy spectrum takes advantage of the significant differences between the signal and backgrounds. With the Phase II upgrade the experiment is sensitive to the shape deformation due to oscillations. May extend sensitivity to 0.008-0.006. > 3M events/near det Neutrino Energy ~3M events/det ~12K events/det Tagged 1800 events/det Tagged
Baseline Optimization • The baseline optimization is sensitive to three effects: • Oscillation wavelength ( 1/Δm2) • Event statistics which fall off like 1/L2 • To the level of systematic error (S/N is a function of L which also varies as 1/L2) Optimize in terms of the invariant, kinematic phase, and the percent of systematic error in terms of statistical error. With Δm2=2.5×10⁻³ and 150% systematic error… L≈1500 meters Kinematic Phase = 1.27Δm2L/E
Braidwood Status • Completed preliminary MOU with Exelon in September 04 • Submitted R&D proposal to NSF and DOE in September 04 • Completed geological site investigation in January 05 which included • 600+ foot bore holes at both the near and far site. • Geophysics tests included: audio-televiewer, passive gamma, resistance probe, calipers and water pressure tests.
Recent Geological Site Investogation Water Pressure Testing Sand and clay ……………….. 37' Carbondale Shale & Sandstone Maquoketa Shale ………………… 140' Maquoketa Limestone ………………… 207' Maquoketa Shale ………………… 271" Galena Limestone & Dolomitic Limestone ………………… 467" Platteville Limestone & Dolomitic Limestone NO TAKE Zones Depth 410 to 450 Depth 450 to 490 Depth 490 to 530 Depth 530 to 570 Depth 570 to 610 Depth 590 to 630 Audio Televiewer and Geophysics Suite GZA GeoEnvironmental, Inc.
Background Radiation at Depth One of the standard geophysics probes measures the natural gamma radiation. Measures rock porosity For us it confirms that the background radiation in dolomitic limestone is low. Near Shaft Far Shaft GZA GeoEnvironmental, Inc.
Braidwood Status • Completed preliminary MOU with Exelon in September 04 • Submitted R&D proposal to NSF and DOE in September 05 • Completed geological site investigation in January 05 which included • 600+ foot bore holes at both the near and far site. • Geophysics tests include: audio-televiewer, passive gamma, resistance probe, calipers and water pressure tests. • Demonstrated a constructive working relationship with Exelon and the Braidwood staff. • We await the guidance of NuSAG.
Conclusions The measurement rests on our ability to understand the near/far relative normalization and to reduce and understand backgrounds. Each piece of the relative normalization can be measured and verified by at least two independent methods. This redundancy is critical to ensure that the high precision goals of the experiment will be meet. Initial, conservative studies indicate that a background of 1 to 2 events/detector/day is achievable. Significant improvement is likely.
Conclusions Sensitivity studies indicate that the Δm2 region preferred by Super-K (1.5×10⁻³ < Δm2 < 3.0×10⁻³) will be covered down to 0.01 (90% CL) in sin22θ13. Phase II, where two detectors are added at the far site for an additional 5 years of running, can extend the reach to 0.007 or better. Phase II could confirm a rate deficit in the baseline experiment with an observation of the shape deformation. Braidwood is an excellent site to make this important measurement!
CHOOZ and Palo Verde Results • Neither experiments found evidence for ne oscillation. • This null result eliminated nm→ne as the primary mechanism for the Super-K atmospheric deficit. < ~ • sin22q13< 0.18 at 90% CL (at Dm2=2.0×10⁻³) • Future experiments should try to improve on these limits by at least an order of magnitude. • Down to sin22q13 0.01 • In other words, a 1% measurement is needed!
Two Zones Design With just two zones some of the Gd capture energy can escape the scintillator undetected. This may result in relative norm. bias. Calibrating detectors to the capture peak virtually eliminates this potential bias. Back…
Detectors Designed to Move Use a rail system for easy transport. The detector needs to carry its electronics and front-end DAQ as these components also play a role in detector efficiency. Multiple far detectors may be used to maintain portability while increasing total volume. Detectors need to fit in the shaft (Diameter ≤7 meters) Detector 9 meters 8 meters Back…