Download
1 / 1
10 likes | 100 Views
Meter Data to Metrics: A Smart Grid Application Keaton Andersen, Chad Brotherton, Jeremy Eldridge Supervisor: Siddharth Suryanarayanan. Information is gathered from a meter capable of capturing high resolution waveform data and can be exported to a computer. .

E N D
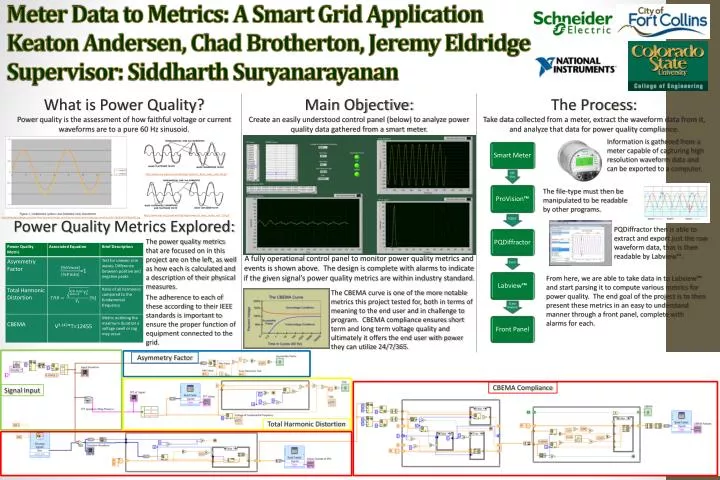
Meter Data to Metrics: A Smart Grid ApplicationKeaton Andersen, Chad Brotherton, Jeremy EldridgeSupervisor: Siddharth Suryanarayanan Information is gathered from a meter capable of capturing high resolution waveform data and can be exported to a computer. http://www.vias.org/crowhurstba/img/crowhurst_basic_audio_vol2-134.gif The file-type must then be manipulated to be readable by other programs. http://www.vias.org/crowhurstba/img/crowhurst_basic_audio_vol2-134.gif http://electronicdesign.com/site-files/electronicdesign.com/files/archive/electronicdesign.com/files/29/17808/fh%20fig%202.jpg PQDiffractor then is able to extract and export just the raw waveform data, that is then readable by Labview™. The power quality metrics that are focused on in this project are on the left, as well as how each is calculated and a description of their physical measures. The adherence to each of these according to their IEEE standards is important to ensure the proper function of equipment connected to the grid. From here, we are able to take data in to Labview™ and start parsing it to compute various metrics for power quality. The end goal of the project is to then present these metrics in an easy to understand manner through a front panel, complete with alarms for each. The CBEMA curve is one of the more notable metrics this project tested for, both in terms of meaning to the end user and in challenge to program. CBEMA compliance ensures short term and long term voltage quality and ultimately it offers the end user with power they can utilize 24/7/365. Asymmetry Factor CBEMA Compliance Signal Input Total Harmonic Distortion