Download
1 / 6
60 likes | 223 Views
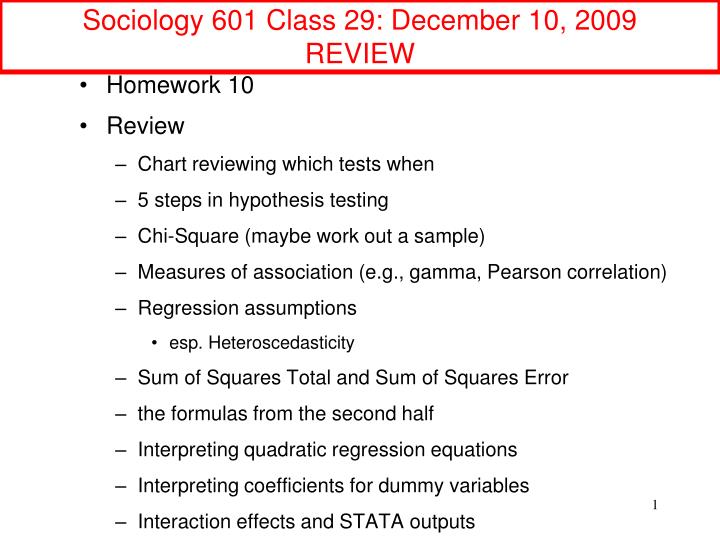
Sociology 601 Class 29: December 10, 2009 REVIEW. Homework 10 Review Chart reviewing which tests when 5 steps in hypothesis testing Chi-Square (maybe work out a sample) Measures of association (e.g., gamma, Pearson correlation) Regression assumptions esp. Heteroscedasticity

E N D
Sociology 601 Class 29: December 10, 2009REVIEW • Homework 10 • Review • Chart reviewing which tests when • 5 steps in hypothesis testing • Chi-Square (maybe work out a sample) • Measures of association (e.g., gamma, Pearson correlation) • Regression assumptions • esp. Heteroscedasticity • Sum of Squares Total and Sum of Squares Error • the formulas from the second half • Interpreting quadratic regression equations • Interpreting coefficients for dummy variables • Interaction effects and STATA outputs
Formalsteps in a significance test Class 6, slide 4+: 1.) List assumptions 2.) State a hypothesis (or two) 3.) Calculate a test statistic 4.) Look up a p - value 5.) State a formal conclusion
Chi-squared Test • Test statistic: • 2 = ((fo – fe)2 / fe ); df = (r-1)*(c-1) • where fo is the observed count in each cell • and where fe is the expected count for each cell. • Assumptions: • two categorical variables (for this course) • random sample or stratified random sample • fe 5 for all cells • Hypothesis: Ho: the two variables are statistically independent. • Example: GSS 1996: married/not married X in lf or not for women 25-54.
Measuring ordinal associations with gammaClass 13, Slide 18 Gamma (γ): A measure for concordant and discordant patterns. gamma = (C –D) / (C+D), where C = number of concordant pairs. D = number of discordant pairs. If gamma is between 0 and +1, the ordinal variables are positively associated. If gamma is between 0 and –1, the ordinal variables are negatively associated. The magnitude of gamma indicates the strength of the association. If gamma = 0, the variables may still be statistically dependent because Chi-squared could still be large. However, the categories may not be dependent in an ordinal sequence.