Download
1 / 23
230 likes | 430 Views
Single Period Inventory Models. Yossi Sheffi Mass Inst of Tech Cambridge, MA. Outline. Single period inventory decisions Calculating the optimal order size Numerically Using spreadsheet Using simulation Analytically The profit function For specific distribution

E N D
Single Period Inventory Models Yossi Sheffi Mass Inst of Tech Cambridge, MA
Outline • Single period inventory decisions • Calculating the optimal order size • Numerically • Using spreadsheet • Using simulation • Analytically • The profit function • For specific distribution • Level of Service • Extensions: • Fixed costs • Risks • Initial inventory • Elastic demand
Single Period Ordering • Seasonal items • Perishable goods • News print • Fashion items • Some high tech products • Risky investments
Selling Magazines • Weekly demand: Total: 4023 magazines Average: 77.4 Mag/week Min: 51; max: 113 Mag/week
Detailed Histogram Frequency (Wks/Yr) Cumm Freq. (Wks/Yr) Demand (Mag/Wk) Average=77.4 Mag/wk
Histogram Cummulative Frequency Cumm Freq. (Wks/Yr) Frequency (Wks/Yr) More Demand (Mag/Wk)
The Ordering Decision(Spreadsheet) • Assume: each magazine sells for: $15 • Cost of each magazine: $8 Order d/wk Prob Exp.Profit: Newsboy Framework – Panel 1: “basic Scenario”
Expected Profits Profit Order Size
Optimal Order (Analytical) • The optimal order is Q* • At Q* the probability of selling one more magazine is the probability that demand is greater than Q* • The expected profit from ordering the (Q*+1)st magazine is: • If demand is high and we sell it: • (REV-COST) x Pr( Demand is higher than Q*) • If demand is low and we are stuck: • (-COST) x Pr( Demand is lower or equal to Q*) • The optimum is where the total expected profit from ordering one more magazine is zero: • (REV-COST) x Pr( Demand > Q*) – COST x Pr( Demand • ≤ Q*) = 0
Optimal Order The “critical ratio”: Cummulative Frequency Frequency (Wks/Yr More Demand (Mag/week)
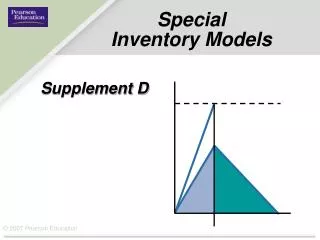
Salvage Value • Salvage value = $4/Mag. Profit Cummulative Frequency Frequency (Wks/Yr) Order Size Demand (Mag/week)
The Profit Function • Revenue from sold items • Revenue or costs associated with unsold items. These may include revenue from salvage or cost associated with disposal. • Costs associated with not meeting customers’ demand. The lost sales cost can include lost of good will and actual penalties for low service. • The cost of buying the merchandise in the first place.
The Profit Function – Simple Case Optimal Order: and:
Level of Service Cycle Service – The probability that there will be a stock-out during a cycle Cycle Service = F(Q) Fill Rate - The probability that a specific customer will encounter a stock-out
REV=$15 COST=$7 Level of Service Service Level Cycle Service Fill Rate Order
Normal Distribution of Demand Expected Profit Order Size
REV=$15 COST=$7 Incorporating Fixed Costs • With fixed costs of $300/order: Expected Profi Order Size
REV=$15 COST=$7 Risk of Loss Probability of Loss Order Quantity 300/(15-7)=37.5. Below that there is no possibility to make money even if we sell ALL the order.
Ordering with Initial Inventory Given initial Inventory: Q0, how to order? 1. Calculate Q* as before 2. If Q0 < Q*, order (Q*< Q0 ) 3. If Q0≥ Q*, order 0 With fixed costs, order only if the expected profits from ordering are more than the ordering costs 1. Set Qcr as the smallest Q such that E[Profits with Qcr]>E[Profits with Q*]-F 2. If Q0 < Qcr, order (Q*< Q0 ) 3. If Q0 ≥ Qcr, order 0 Note: the cost of Q0 is irrelevant
REV=$15 COST=$7 Ordering with FixedCosts and Initial Inventory Example: F = $150 Expected Profit Initial Inventory •If initial inventory is LE 46, order up to 80 •If initial inventory is GE 47, order nothing
Expected Profit Function Elastic Demand Profit • μ =D(P); σ = f(μ) • Procedure: • 1. Set P • 2. Calculate μ • 3. Calculate σ • 4. • 5. Calculate optimal expected profits as a function of P. Price P* = $22 Q*= 65 Mag μ(p)=56 Mag σ= 28 Exp. Profit=$543 Rev = $15 Cost= $8 μ(p)=165-5*p σ= μ/2
Any Questions? Yossi Sheffi