Download
1 / 23
230 likes | 369 Views
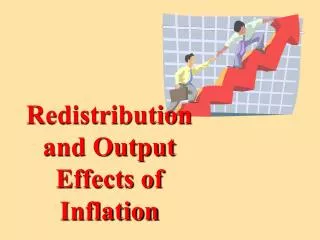
Redistribution Effects of Energy and Climate Policy. Lion Hirth , Falko Ueckerdt. International Energy Workshop University of Cape Town 2012-06-19. Redistribution: changes in economic surpluses of 3 sectors . Three sectors: Producers (existing generators), Consumers, Government

E N D
Redistribution Effects of Energy and Climate Policy Lion Hirth, Falko Ueckerdt International Energy Workshop University of Cape Town2012-06-19
Redistribution: changes in economic surpluses of 3 sectors. Three sectors: Producers (existing generators), Consumers, Government Two policies: Renewable support 2. CO2pricing The same methodological framework is applied in two models Analytical model: understand chain of causality, derive qualitative findings Numerical model (North-Western Europe): quantify, assess ambiguous results Goal: explain and quantify the redistribution flows induced by climate and energy policy RES support CO2 pricing Government Producers Government Producers Consumers Consumers
Redistribution large relative to welfare effects RES support: electricity price decreases producers lose, consumers win RES support State pays CO2 pricing: electricity price increases effect on producers depends on technology mix, consumers lose auction / tax revenues government net income increases Opposite flows policy mix allows CO2 mitigation without changing profits Conclusions RES support CO2 pricing Government Producers Government Producers Consumers Consumers
Redistribution large relative to welfare effects RES support: electricity price decreases producers lose, consumers win RES support State pays CO2 pricing: electricity price increases effect on producers depends on technology mix, consumers lose auction / tax revenues government net income increases Opposite flows policy mix allows CO2 mitigation without changing profits Conclusions RES support + CO2pricing Government Producers Consumers
Connecting two branches of the literature • Merit-order literature • How much does subsidized wind generation reduce the electricity price? • Do consumers gain, even if they pay the subsidy? • Sensfuss (2007), Sensfuß et al. (2008), Sáenz de Miera et al. (2008), Munksgaard & Morthorst (2008), MacCormack et al. (2010), Rathmann (2007), O’Mahoney & Denny (2011), Gil et al. (2012) • CO2 pricing literature • How do producer profits change when carbon trading is introduced (depending on different allocation rules for emissions allowances)? • To what extend can CO2costs be passed through to consumers? • Martinez & Neuhoff (2005), Chen et al. (2008), Burtraw et al. (2002), Bode (2006), Sijm et al. (2006) 5
Long-term equilibrium (LTE) without policies • capital stock endogenous (“green field approach”) • scarcity prices long-term profits zero (free market entry, perfect competition) investments sunk • Short-term equilibrium (STE) prior to policy • capital stock is given (investment is possible) • no scarcity prices • short-term profits positive (used to pay back capital cost) Effect of a policy (def.): compare profitsbefore and afterpolicy is introduced methodological framewok policy introduced CO2 pricing Both policies New STE with RES support short-term profits changed capital stock endogenous Difference between policies (def.): compare profits betweentwo new STEs • New LTE with RES support • LTE changed • zero LT profits … … This framework is applied in an analytical and a numerical model 6
Analytical model • Two generation technologies: coal and gas • Methodology • “classical approach” to investment planning: • screening curve • load duration curve (LDC) • price duration curve (PDC) • assumptions: inelastic demand, no externalities, perfect competition, perfect foresight, no intertemporal constraints, no trade, no storage, energy-only markets • Long-term equilibrium (derived in the paper) • market equilibrium is cost-minimum • long-term profits of all technologies are zero • scarcity prices assure that there is no “missing money” Long-term screening curves C total costs (€/MW-year) Gas Coal T (hours per year) T1 q Load (MW) (Residual) load duration curve p (€/MWh) Price duration curve ps Δ T1 T (hours per year) 7
The short-term equilibrium • investments are sunk no capital cost • capacity is constrained • no scarcity prices • Results • base-load technology makes ST profits Long-term screening curves Short-term screening curves C total costs (€/MW-year) Gas Coal Coal T (hours per year) T1 T T1 q Load (MW) (Residual) load duration curve T p (€/MWh) Price duration curve ps Δ T1 T1 T (hours per year) T 8
Short-term screening curves C (€/MW-year) CO2 pricing Coal T1 T q (MW) RES support T p (€/MWh) T1 T 9
Without support With wind support • Wind Support • changes the LDC to RLDC • strictly reduces producer rents C (€/MW-year) Short-term screening curves Short-term screening curves C (€/MW-year) Gas Coal Coal T1 T T1 T q (MW) q (MW) RES support T T p (€/MWh) p (€/MWh) T1 T2wind T1 T T 10
CO2 pricing • Is more complex and shown in paper • Effect on producers depends on technology and CO2 price Short-term screening curves C (€/MW-year) CO2 pricing Coal T1 T q (MW) T p (€/MWh) T1 T 11
Model & scenario setup Numerical model why numerical modelling? quantitative estimates for North-Western Europe (orders of magnitude) ten technologies (wind, solar, eight dispatchable, pump hydro) interconnectors, storage, CHP, ancillary services Same framework applied long-term equilibrium short-term equilibrium policy shocks integrated dispatch and investment hourly time steps for a full year existing plant stack, storage and interconnectors endogenous (dis-)investments in generation, storage and interconnectors via annualized investment costs 1M equations, 4M non-zeros, solving time ½ h
How big is the redistribution effect of wind support? 70% of Nuclear, 60% of coal, 50% of gas profits are taken away Externalities ignored Redistribution effect is large Consumers gain even if they pay for subsidies 13
Wind support CO2 pricing Technology dependence Existing generators’ ST profits increase Wind support and CO2 pricing induce opposite redistribution flows
Questions?Comments?Ideas? Falko.ueckerdt@pik-potsdam.de
How big is the redistribution effect of CO2 pricing? Technology dependence Existing generators’ ST profits increase Wind support and CO2 pricing induce opposite redistribution flows 16
CO2 pricing: short-term screening curves pivot (a) Rents are generated by coal power plants when gas power plants are price-setting. (b) The difference of variable costs decreases, thus the coal rents decrease. The dispatch remains unchanged. (c) No rents occur because variable costs of coal and gas power plants are equal. (65€/t CO2) (d) Now the dispatch changes: Gas power plants now have least variable costs and cover base load. Coal power plants only cover the remaining base, mid and peak load. Gas power plants generate rents when coal power plants are price-setting. (e) The screening curve of coal touches the screening curve of new gas power plants. The rents of gas power plants reach a maximum. (80€/t CO2) (f) Now, new investments in gas power plants lead to decommissioning of existing coal capacity. Old gas power plants are the only plants that generate rents. These rents remain at their maximum value. C total costs (€/kW - year) C Gas Gas Coal Coal T1 T T1 T (a) (b) C total costs (€/kW - year) C New Gas Coal Gas Gas Coal T1 T T T2CO2 (c) (d) Coal C total costs (€/kW - year) C New Gas New Gas Coal Gas Gas T2CO2 T T2CO2 T (e) (f) Assuming variable costs of 25 €/MWhth (gas) and 12 €/MWhth (coal), efficiencies of 48% (gas) and 39% (coal), carbon intensities of 0,24 t/MWhth (gas) and 0,32 t/MWhth (coal) and investment costs of 100€/kWa (gas).
The effect of CO2 pricing No CO2-Pricing CO2-Pricing • With high CO2 price: Shift of rents only depends on the initial long-term capacity mix General results • Total producer profits depend on long-term capacities and CO2 price • Large redistribution within producers depending on technologies • More low-carbon technology total producer rents tend to increase • Consumers pay • State benefits Short-term screening curves Short-term screening curves C (€/MW-year) C (€/MW-year) Coal New Gas Gas Coal T1 T T1 T2CO2 T q (MW) q (MW) New gas replaced T T p (€/MWh) North-Western Europe? Numerical model T1 T T1 T2CO2 T
This paper brings together two branches of literature Merit-order literature Decrease of spot market prices due to renewable electricity generation savings for the consumer Sensfuss 2007, 2008, de Miera et al. 2008, Munksgaard & Morthorst2008 CO2 pricing literature How do producer profits change (depending on different allocation rules for emissions allowances)? To what extend CO2costs can be passed through to consumers? Martinez & Neuhoff2005, Chen et al. 2008, Burtraw et al. 2002 Our work adds to the literature in three ways. • effects of both policies in a consistent framework with the long-term equilibrium as benchmark • focus on redistribution effects: evolution of effects at different levels of policy intervention and comprehensive accounting of all flows • analytical model to trace causal mechanisms and numerical model for quantifications
No CO2-Pricing CO2-Pricing CO2 pricing within a nuclear system tends to increase conventional rents Short-term screening curves Short-term screening curves C (€/MW-year) C (€/MW-year) Coal New Gas • xx Gas Gas Coal T1 T T1 T2CO2 T (a) (b) q (MW) q (MW) T T (c) (d) p (€/MWh) p (€/MWh) T1 T T1 T2CO2 T (e) (f)
C total costs (€/MW-year) Long-term screening curves Long-term equilibrium with nuclear Gas • Back-up slide Coal T1 • T • (hours per year) (a) q Load (MW) • T • (hours per year) p (€/MWh) (b) ps Δ T1 • T • (hours per year) (c)
Model & scenario setup why numerical modelling? quantitative estimates for North-Western Europe (orders of magnitude) ten technologies (wind, solar, eight dispatchable, pump hydro) interconnectors, storage, CHP, ancillary services Same framework applied long-term equilibrium short-term equilibrium policy shocks integrated dispatch and investment hourly time steps for a full year existing plant stack, storage and interconnectors endogenous (dis-)investments in generation, storage and interconnectors via annualized investment costs stylized electricity market model total system costs are minimized with respect to investment and dispatch decisions under a large set of technical constraints no market power, externalities or other market imperfections cost minimization is equivalent to profit-maximizing firms electricity price is set by variable cost of marginal plant no load flow, NTCs between market areas back-tested and calibrated to market prices 1M equations, 4M non-zeros, solving time ½ h