Download

1 / 16
660 likes | 1.04k Views
Practical Research 2:. The Nature of Inquiry and Research. VON CHRISTOPHER G. CHUA von_christopher_chua@dlsu.edu.ph. Our Learning Goals:. The Nature of Inquiry and Research. After this discussion, you are expected to have the ability to…

E N D
Practical Research 2: The Nature of Inquiry and Research VON CHRISTOPHER G. CHUA von_christopher_chua@dlsu.edu.ph
Our Learning Goals: The Nature of Inquiry and Research After this discussion, you are expected to have the ability to… describe characteristics, strengths, and weaknesses of quantitative research; differentiate kinds of variables according to scales of measure; and contrast kinds of quantitative research. This slideshow presentation will be made available through the trainer’s website: mathbychua.weebly.com. Download the document to use it as reference.
How would you define practical research? Why is it important for a SHS student to know the process of conducting research? Give some examples of research opportunities or topics relevant to both your interests and your SHS strand. • Let’s look back…
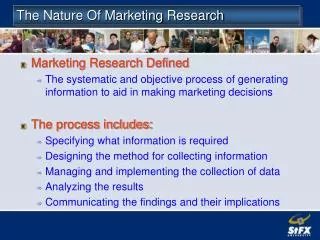
Research is a systematic process of collecting, analyzing, and interpreting information in order to increase our understanding of a phenomenon about which we are interested or concerned (Leedy & Ormrod, 2013). • Defining Research
works with a system or method unbiased; all angles presented Research is a systematic and objective creation of knowledge. (Creswell, 2013) a creative process Present the answer Collect data to answer to the question • Defining Research Pose a question
Add to existing knowledge. Improve practice. Inform policies Solve problems, not emergencies. 1 2 3 4 WhyDO RESEARCH?
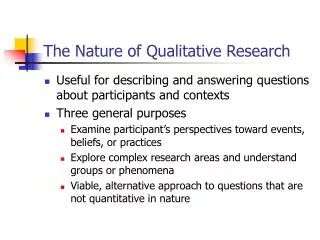
In comparison to qualitative research. Fraenkel & Wallen, 2009 single reality vs. multiple realities establishing relationships and explaining cause of correlation vs. understanding situations in a participant’s perspective pre-established design vs. emerging design detached researcher vs. immersed researcher to generalize vs. to assess applicability 1 2 3 4 Quantitative Research 5
Quantitive Research Its STRENGTHS and WEAKNESSES • Precision of numbers • Level of significance (statistical) can be determined – that results are not due to chance alone • Sample is less prone to sampling bias • Error can be computed, e.g., sampling error Addressing Weaknesses of Quantitative Research • Rigor in doing quantitative research procedures • Addition of qualitative analysis using quotes of subjects (persons from whom data are collected) to support statistical results • Inadequacy of numbers for total picture and depth of analysis • Less than 100% accuracy in sampling, instrument construction and administration • Assumptions in statistical methods
A variable varies and has values. The values of variables under study are the research data. Are these variables? color, chair, shape of table, tweet, shirt style. How are these different? Quantitative and qualitative variables Discrete and continuous variables • Variables
Daily Allowance Availability of Internet Connection Time Temperature Test Score Position in Student Government Cellphone Brand Height Cellphone number Class rank in the honor roll Which goes where? AGE GRADE LEVEL GENDER ACTIVITY TWO Classify the variables at the right based on their “likelihood” to the three others in the color-coded columns.
A variable varies and has values. The values of variables under study are the research data. Are these variables? chair, shape of table, tweet, shirt style. Classifying Variables according to Scales of Measure • Variables ORDINAL NOMINAL RATIO INTERVAL IDENTITY MAGNITUDE EQUAL INTERVALS ABSOLUTE ZERO
Quantitative Research Designs Correla tional Experi mental Manipulating conditions and studying effects Studying relationships Non-experimental research Descrip tive Describing characteristics
Quantitative Research Designs Descriptive Research Examples: What are the sleeping habits of SHS students in DLSAU? What factors affected the SHS track choice of SHS students? A cross-sectional survey collects information from a sample coming from various groups that has been drawn from a predetermined population. Sometimes called survey research, it aims to describe systematically the facts and characteristics of a given population or area of interest, factually and accurately Your Turn Consider your chosen research interest or topic. Come up with a research question that falls under descriptive research.
Quantitative Research Designs Correlational Research Explanatory research design determines the extent to which two variables (or more) co-vary. Examples: Does wearing school uniform have any relationship with students’ ability to participate? Is there a relationship between phone brand and Facebook usage among teens? Prediction research design seeks to identify variables that will predict an outcome or criterion. aims to describe and measure the degree of association between two or more variables or sets of scores. Your Turn Consider your chosen research interest or topic. Come up with a research question that falls under correlational research.
Quantitative Research Designs Experimental Research Types True experiments EG: R O1 x O2 CG: R O1 x O2 Quasi-experiments EG: O1 x O2 CG: O1 x O2 Independent variable attempts to influence a particular variable tests hypotheses about cause-and-effect relationships Dependent variable
Internet availability at home and student’s average sleeping time at night Social media involvement and practices of Grade 12 HUMSS students The effect of the use of <a local packaging material> on the shelf life of a product. The marketability of <innovative product> to SHS students. Children of single parents and their level of Math anxiety. Determine the design ACTIVITY ONE As a group, decide on a researchable topic leading to a quantitative research suited to the level of SHS students.