Download
1 / 14
140 likes | 256 Views
Global altimetric marine gravity field mapping The impact of Cryosat-2. Ole B. Andersen and L. Stenseng Acknowledging support/data and coorporation with the NGA (US) And retracked ERS from P. Berry (UK). Outline. Satellite altimetry – State of the art gravity

E N D
Global altimetric marine gravity field mappingThe impact of Cryosat-2 Ole B. Andersen and L. Stenseng Acknowledging support/data and coorporation with the NGA (US) And retracked ERS from P. Berry (UK)
Outline • Satellite altimetry – State of the art gravity • Cryosat-2 (what it offers) – ”new geodetic mission”. • Noise estimation (20 Hz vs 1 Hz) for Gravity • DTU12 Beta.
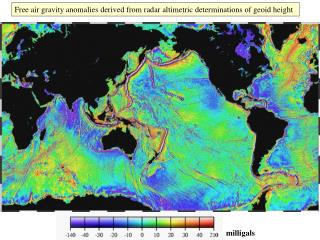
Gravity field Gravity field Gravity field sea mount The (mean) Sea surface height mimicks the geoid Gravity from MDT corrected MSS (= Geoid) Laplace 1 mGal -> Alongtrack heights differences over 10 km need to be accurate to <1 cm
C2 will improve Shortwavelength scale signal Bathymetry -> oceanography Long wavelength signal still in error.
Cryosat ”promises” Conventional DD Cryosat Factor of 2 onsshaccuracy over conventionalaltimetry Accuracy independent of Seastate: Jason-1: 1 Hz (altimnoise = 1.5 cm): 20 Hz = 6.4 cm C2 DD: 1 Hz (altimnoise = 0.75 cm): 20 Hz LRM = 3.2 cm (sqrtaveraging)
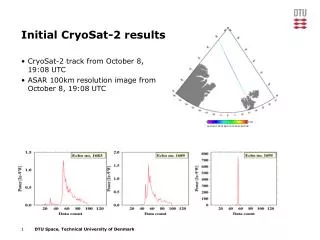
SAR-In ESA Level 2 GDR Products. (20 Hz data) Identical profile 2011 / 2012 All corr applied NOAA 1 Hz LRM data All corr applied SAR LRM Hawaii
18 Hz Cryosat LRM SAR SAR-In >100 mGal 2011 V 2.1 2012 V 2.4 Large ”jumps” at mode shift SOUTH North
DTU 2012 Beta Coastal regions heavily improved Including CRYOSAT LRM data - 30% more data. Currently investigating ESA L2 LRM vs NOAA LRM data. Including Retracked L1 CRYOSAT SAR and SAR-In data Has to solve for ”mode jumps first” Updating all existing GM data. Ocean tide correction updated to GOT 4.7 SSB correction updated (N/A for Cryosat-2) Dynamic Atmosphere updated from IB alone
DTU 2012 Beta Coastal regions heavily improved Preliminary testing using 1.6 years of NOAA C2 LRM Data
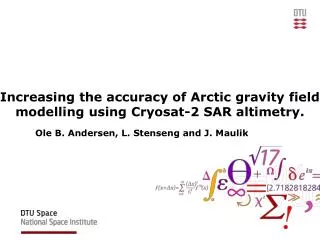
Retracking of Cryosat-2 SAR • Level 1b SAR waveform (black) with fitted five parameter beta retracker with exponential tail (blue) and surface estimate (red). COG – Center of Gravity Level 1b SAR waveform (black) with fitted five parameter beta retracker with exponential tail (blue) and surface estimate (red). Green is cut off for leading edge Center of Gravity
Summary ESA L2 LRM are very good for marine gravity Processor upg (2.1-2.4) removes spikes and is better for SAR-In But increases noise for LRM Jumps between modes are clear and needs to be handled Current Cryosat 2 data are comparable to retracked GM altimetry Aims at releasing DTU12 at “20 years progress of altimetry” Jason-1 EOL Geodetic Mission ? Acknowledgement: Support/data and coorporation with the NGA (US)