Download
1 / 44
440 likes | 578 Views
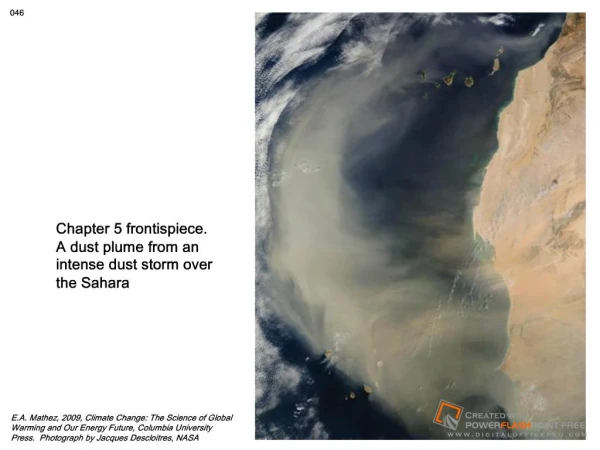
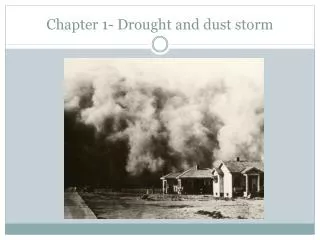
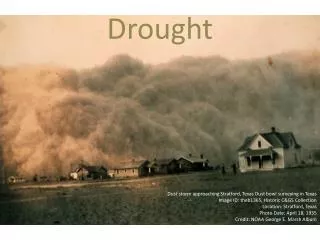
Dust storm 1935. NWS Medium-Range and Long-Range Forecasts. Ed O’Lenic National Weather Service. Summary. The Sun is the ultimate source of all weather and climate variability. Climate is the average of weather over weeks or longer.

E N D
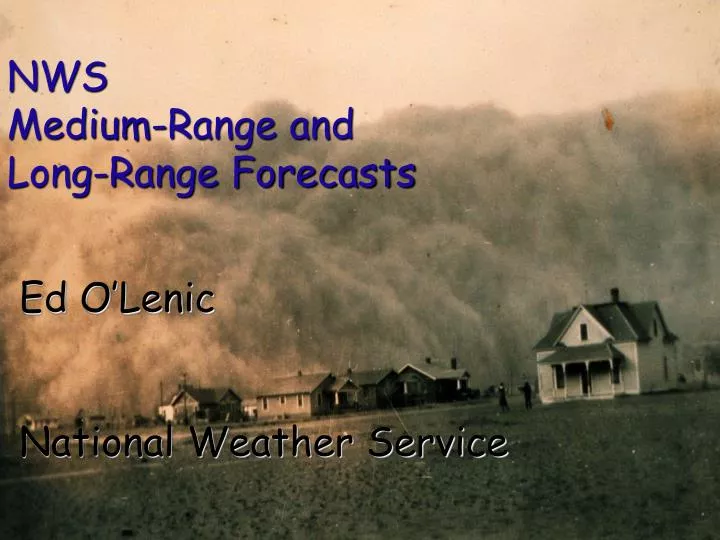
Dust storm 1935 NWS Medium-Range and Long-Range Forecasts Ed O’Lenic National Weather Service
Summary • The Sun is the ultimate source of all weather and climate variability. • Climate is the average of weather over weeks or longer. • Climate variability (CV) is driven by the tropical oceans, which have a long “memory” and by complicated interactions among ocean, atmosphere and land. • Dynamical models are our best hope for predicting weather and climate. • The climate system is noisy. Only a small portion of CV is predictable – mainly ENSO, some lesser tropical disturbances, and a number of known mid-latitude disturbances. • Prediction in 2004 is increasingly invested in dynamical models. • Humans assess uncertainty in the models using large numbers of forecasts called ensembles and construct the forecasts subjectively. • Quantitative assessments of forecast performance relative to some standard (skill) are used to condition the use of the forecast tools, to assign probabilities and to inform users. • Automated objective forecasts, a possibility in the future, heighten security risks, since they are more reproducible than human ones.
The Weather-Climate Link • Wildly oscillating curve = daily “weather” • Smooth curve = 30 year mean (climatology) Subtracting the climatology and performing a 31-day running mean reveals the low-frequency signal or short-term climate variations we are trying to predict.
Time series Examples of time series VALUE -> 0 10 20 30 40 50 60 70 80 90 100 TIME
Standard deviation of winter-time (DJF) 500 hPa height for DAILY, WEEKLY, MONTHLY and SEASONAL time scales. D M Standard deviation ofwinter-time (DJF) 500 hPa height forDAILY, WEEKLY, MONTHLY and SEASONALtime scales. W S
Time Behavior: Frequency Spectra 8. White noise is a time series that has the same variance in every frequency, i.e. a flat spectrum: Power Frequency
Time Behavior: Autocorrelation • A special form of autocorrelation occurs when a time series can be represented by The prime represents a departure from the time series mean, often called an anomaly, and epsilon white noise. This is called a first-order Markov process, damped persistence, and red noise. They all mean the same thing.
Time Behavior: Autocorrelation Spectra power • The remarkable thing about red noise is that its spectrum is characterized by increasing variance towards lower frequencies: Thus time series of red noise exhibit trends and swings that can be misinterpreted as deterministic or systematic, when they are just part of a ‘drunkard’s walk.’ frequency anomalies day
Definitions - Weather – A snapshot of the atmosphere. - Climate – A “time exposure” of the weather over weeks - years. - Climate Forecast – Probability of unusual warm, cold, wet, dry, stormy, calm, conditions over weeks, seasons, … - Natural Variability – Range of possible values of climate. - Skill – Accuracy of a forecast compared to a standard. - Dynamical Model – Allows physically-based calculation of likely future values of weather/climate variables. - Statistical Model – Uses empirical relationships to calculate likely future values of weather/climate variables. - ENSO – El Nino/Southern Oscillation, comprised of El Nino, Neutral, La Nina
Forecast Process Schematic Recent observations Dynamical model forecasts/multi-model ensembles Historical observations.. Verifications/Statistical tools Downscaling, Analogs, Composites WEB PAGES/AUTOMATED DATABASES Peer-reviews of the forecast tools and of the penultimate forecast via web/telephone conference with partners and through local discussions (map discussions,sanity check, conference calls, etc…) Forecaster-created or automated products Dissemination to public
Long-Range Temperature Forecast Process RECENT AND HISTORICAL OBSERVATIONS - Mean and typical variability (climatology) - Most recent status of the atmosphere - Developmental data for statistical models - Starting values for dynamical models - Verification data for models and forecasts ASSESSMENT OF UNCERTAINTY - Ensembles of forecasts/inter-compare models - Status of ENSO - Known skill of models - Bias removal HUMAN PREDICTION - Community assessment of forecast models - Remove uncorrected biases - Make categorical forecasts - Assign probabilities subjectively DISSEMINATE
Climatology – The “what” we compare things to, is just the 30-year average of something, like ocean temperature.
The El Nino/Southern Oscillation (ENSO) is a major factor in global climate variability. ENSO SST and SSTa
Very strong ENSO events produce reliable impacts on short-term U.S. climate, unfortunately, few ENSO events are.
Isabel Hurricane Isabel about to make landfall Sep 18, 2003
CPC’s Seasonal forecasts, a collaborative activity Each month, on the second Friday, and the following Tuesday, CPC joins with our main collaborators - NOAA’s Climate Diagnostics Center (CDC) and the private, non-profit, NOAA- supported International Institute for Climate Prediction (IRI) to discuss the recent status of the climate system, the performance of our recent forecasts, and the information available in the latest set of forecast tools (Friday) and the first draft of the forecast (Tuesday). CPC’s Official Forecast is released on the third Thursday of the month at 8:30 AM. A web page and a telephone conference call are used to exchange information. Impact on markets is less than 6-10- and 8-14-day forecasts.
CPC’s Medium-Range Forecasts • Valid for an average of days 6-10 and 8-14 in the future • Prepared daily. Weekdays by a human. Weekend automated. • Relies nearly completely on dynamical model forecasts. • A single forecaster prepares the forecast and releases it at 3PM • Secure computer systems are used to disseminate the forecasts • Internet and NWS circuits are used to disseminate. • No outside collaboration is used. • Strongly impacts markets.
MRF die off curve DIE-OFF of model daily forecast skill
Medium-Range Forecast Process Mirrors that for Long-Range RECENT AND HISTORICAL OBSERVATIONS - Mean and typical variability (climatology) - Most recent status of the atmosphere - Developmental data for statistical models - Starting values for dynamical models - Verification data for models and forecasts ASSESSMENT OF UNCERTAINTY - Ensembles of forecasts/inter-compare models - Status of major circulation anomalies - Known skill of models - Bias removal HUMAN PREDICTION - Assessment of forecast models - Remove uncorrected biases - Make categorical forecasts - Assign probabilities subjectively DISSEMINATE
Summary • The Sun is the ultimate source of all weather and climate variability. • Climate is the average of weather over weeks or longer. • Climate variability (CV) is driven by the tropical oceans, which have a long “memory” and by complicated interactions among ocean, atmosphere and land. • Dynamical models are our best hope for predicting weather and climate. • The climate system is noisy. Only a small portion of CV is predictable – mainly ENSO, some lesser tropical disturbances, and a number of known mid-latitude disturbances. • Prediction in 2004 is increasingly invested in dynamical models. • Humans assess uncertainty in the models using large numbers of forecasts called ensembles and construct the forecasts subjectively. • Quantitative assessments of forecast performance relative to some standard (skill) are used to condition the use of the forecast tools, to assign probabilities and to inform users. • Automated objective forecasts, a possibility in the future, heighten security risks, since they are more reproducible than human ones.