Download
1 / 49
490 likes | 747 Views
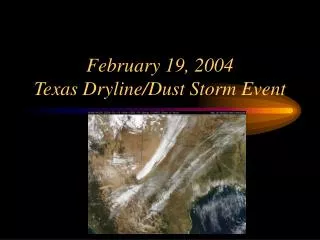
Feb TexMex Dust Storm Analysis. Satellite. 250m image. The National Polar-orbiting Operational Environmental Satellite System (NPOESS) represents this country’s next generation of polar-orbiting environmental satellite.

E N D
Satellite 250m image
The National Polar-orbiting Operational Environmental Satellite System (NPOESS) represents this country’s next generation of polar-orbiting environmental satellite. • These projects involve improved tactical communications - direct broadcast field terminals, data mining techniques for large heterogeneous data bases, data retrieval algorithm development, data assimilation for nowcasting applications, combat simulations quantifying the value of data to the manager exploring other remote sensing technologies to augment NPOESS and. • NPOESS Preparatory Project (NPP) to launch in 2006, will provide a bridge from NASA’s EOS research missions (Terra, Aqua, and Aura) to the operational NPOESS mission in the years that follow. • America’s future (2012 period) geostationary satellite series, GOES-R, is expected to be a geostationary constellation whose major meteorological observing instruments are an Advanced Baseline Imager (ABI) with up to 16 channels, and a Hyperspectral Environmental Suite (HES) that is comprised of a hyperspectral imager operating in the 0.4 to 1 micron range (HES-I) and an atmospheric sounder operating across the 4-15 micron portion of the spectrum (HES-II). That instrument is the GOES-R HES-I with a spatial resolution on the order of 100 to 150 meters operating at 10 nanometer spectral resolution across the 0.4 to 1.0 micron range across a domain of 100x100 kilometers and capable of being refreshed at 5 to 10 times per minute • This report documents a significant dust storm outbreak that occurred on 3 March 2003 over the Gulf of Oman. The case study demonstrates the effective synergy of the AOD product together with various other satellite-derived products on the NRL Satellite Focus page and the Navy Aerosol Analysis and Prediction System (NAAPS) to characterize visibility conditions over data sparse/data denied regions. Nearby synoptic surface reports serve as validation to the satellite and model-derived products presented herein. This report also describes the limitations and shortcomings of the current AOD product arising from sun glint, clouds and water turbidity contamination factors.
Presently, the Naval Research Laboratory’s global and regional dust models (NAAPS and COAMPSTM Dust) use the USGS land use characteristic dataset to determine dust emission areas. Since its compilation a decade ago, two major weaknesses in the USGS land use characteristic dataset have become apparent. 1. The land uses describing arid and semi-arid regions in Asia and Southwest Asia have quickly become outdated. To update and to improve the USGS dataset, we are using GIS-like software named ENVI (Environment for Visualizing Images), 1 km National Geophysical Data Center (NGDC) global topographical data, satellite imagery, maps, atlases, and recently released governmental reports. • The science behind the Air Force Weather Agency’s (AFWA) Dust Transport Application (DTA) is discussed and the results of an extensive verification of DTA over Africa, central and southwest Asia are presented. DTA ingests AFWA MM5 45km resolution surface wind data, which is used to calculate the surface dust flux based on wind threshold velocity. There are differing threshold velocities based upon the dust particles’ diameter, air and particle density, and soil moisture. DTA also accounts for the vertical transport of dust through the calculation of horizontal divergence and a second parameter that calculates vertical diffusion. In addition, DTA uses a dust source region database that was developed on the basis of land use, topography, the use of Advanced Very High Resolution Radiometer (AVHRR), and Total Ozone Mapping Spectrometer (TOMS) data. • A dust aerosol model has been developed and fully embedded in the Navy’s COAMPSTM as an on-line module of the prediction system, using the exact meteorological fields at each time step and each grid point of all nests. COAMPSTM is being applied to the experimental dust forecasts for Southwest Asia including Iraq and Persian Gulf in Spring 2003, the season of high frequency of sandstorms in the region. The model is run twice a day at 00Z and 12Z to produce 3-day forecasts at 9, 27 and 81-km grid resolutions.
SATELLITE FOCUS: A DYNAMIC, NEAR REAL-TIME SATELLITE RESOURCE FOR THE DoD. (NRL) in Monterey accelerated the development and transition to operations of a new web-based satellite imagery interface. The philosophy of the “Satellite Focus” web page is sector-centric; a wide variety of value-added products populate the website in near real-time over co-registered domains. This provides one stop shopping for the analyst, thereby mitigating the often-burdensome task of searching for necessary information across a myriad of independent resources of variable coverage, capability, quality, and timeliness. A completely dynamic tool, the interface evolves with the introduction of new sectors and products. Intelligent architecture and site navigation, customizable animation, image mosaics, satellite overpass prediction and on-line product tutorials support cutting-edge satellite multi-spectral and model-fusion products developed by NRL Satellite Meteorological Applications Section scientists using a full complement of polar/geostationary satellites and NWP fields. Highlighted among these products are the high-resolution multi-spectral applications available from the Moderate Resolution Imaging Spectroradiometer (MODIS), a telemetry received in near real-time via special arrangement between NOAA, NASA, and DoD agencies in direct support of the War on Terrorism. A mirror website transitioned to Fleet Numerical Meteorology and Oceanography Center has made Satellite Focus available upon Secure Internet bandwidth and thereby more readily accessible to assets in theater. Constructive feedback from a wide variety of operational users during OEF and OIF has helped to further develop and optimize this resource. Constructive feedback from a wide variety of operational users during OEF and OIF has helped to further develop and optimize this resource. The FNMOC Dust Discussion. Dust event forecasting is an emerging, but still immature science. With the onset of war in Iraq, forecasting dust has become an important issue, and forecasters in theater have been doing their best to forecast dust effects on operations for pilots, ground forces, and ships at sea. As forces move further inland, dust events present both a problem and an opportunity for effective deployment of U.S. forces. Toward this end, FNMOC has taken a two-pronged approach by 1) upgrading its array of satellite and model dust products, and 2) reorganizing its operational watch team to focus on dust analysis and forecasting. FNMOC began to make use of the NRL/MRY Aerosol Group's Navy Atmospheric Aerosol Prediction System (NAAPS) products prior to formal transition to operations. At NRL, the Coupled Ocean/Atmosphere Mesoscale Prediction System (COAMPS) was enhanced to provide aerosol prediction for Southwest Asia, and preliminary model aerosol output from COAMPS was made available for evaluation starting in March of 2003 An important aspect of FNMOC’s new strategy is to increase situational awareness and interaction with forward deployed forecasters who directly support the warfighter. To accomplish this objective, the Operations Department watch standers’ duties were restructured to include a daily analysis of the dust products available on the Satellite Focus and NAAPS Web pages. This daily analysis was termed the “Dust Discussion”. The procedures for this analysis and the content of the Dust Discussion were developed by a group of watch standers, scientists and forecasters from FNMOC and NRL, who meet on a weekly basis to provide guidance, review results, and modify procedures or content as necessary. The watch standers have undergone training to learn how to forecast dust events. Training has included analysis of satellite imagery, basic dust storm physics, forecasting tips, and resource utilization topics.
FIRES: Unlike aerosol species such as dust and smoke who’s source functions can be determined through dynamical fields, most fires are anthropogenic in nature and hence emissions vary considerably from day to day. To support field operations that rely on EO systems, propagation models need to be able to quickly adapt to new fires. The smoke component of the Navy Aerosol Analysis and Prediction System (NAAPS) utilizes real time fire detection algorithms from geostationary satellites with the NOAA/NESDIS Automated Biomass Burning Algorithm (ABBA) and from MODIS with the University of Maryland RapidFire and NRL fire hotspot algorithms. We also discuss and contrast the physical optical properties of biomass and oil fire smokes and how they relate to light extinction in visible and IR wavelengths. • 2D-4D grid data distribution system and its use in support of tactical operations. The data have been used in secondary modeling systems (surf, EM propagation, and chemical dispersion forecasts), planning tools for flight and landing missions (JMPS, Brandes Associates), and for display on a common operational desktop (WebCOP/XiS, Polexis). We store NOGAPS, COAMPS, WW3, SWAN and other model grids. Other parts of Metcast store derived data (ship routes, surf forecasts). The built-in fine-grained access control allows the system to be used for coalition support and joint operations. • The system incorporates the Grid DataBlade (Barrodale Computing Services) —stores tiles of scalar and vector grids arranged in time and the vertical dimension. The DataBlade can compute a subgrid, select a vertical post, re-project and interpolate in any dimension. Because these computations are performed within the database engine, they are highly efficient. A flexible query system lets the user select a 1D-4D (sub)grid based on a model, geographical region, valid time and other criteria. The user can also request a desired interpolation mode or remapping, e.g. from a Lambert-Conformal projection to spherical coordinates. The data distribution system is reflective and can describe, in various levels of detail, which gridded data are potentially or currently available.
Project Goal and Objective The goal of the project is to provide technical support to EPA & RPOs on: Estimation of Natural Visibility Conditions over the US Tasks and Approach: • Conceptual Evaluation of Natural PM and Visibility Conditions • Establish Virtual Workgroup with representatives from EPA, RPOs, scientific community • Quantitative Estimation of Recent Regional Natural Contribution Statistics • Conduct Data Analysis for estimating natural contributions (1995+, surf. and satellite obs) • Real-Time Estimation of Natural Aerosols and Visibility • Implement a Web-based Tool for routine real-time estimation of natural aerosols/visibility
Task 1: Conceptual Evaluation of Natural PM and Visibility Conditions • Establishing the main natural source types, e.g. • Windblown dust (local and distant) • Biomass smoke (forest, grass and other uncontrolled fires, local and distant) • Biogenic emissions (trees, marshes, oceans) • Sea salt • Physico-chemical properties of natural aerosols • Size distribution • Chemical composition • Optical properties • Evaluate suitable metrics for statistically describing natural conditions • Relevant aerosol components (e.g. SO4, NO3, OC, EC, Dust) • Spatial scales and resolution of natural events/conditions • Temporal scales and resolution of natural events/conditions
Background • Atmospheric aerosol system has three extra dimensions (red), compared to gases (blue): • Spatial dimensions (X, Y, Z) • Temporal Dimensions (T) • Particle size (D) • Particle Composition ( C ) • Particle Shape (S) • Bad news: The mere characterization of the 7D aerosol system is a challenge • Spatially dense network -X, Y, Z(??) • Continuous monitoring (T) • Size segregated sampling (D) • Speciated analysis ( C ) • Shape (??) • Good news: The aerosol system is self-describing. • Once the aerosol is characterized (Speciated monitoring) and multidimensional aerosol data are organized, (see RPO VIEWS effort), unique opportunities exists for extracting information about the aerosol system (sources, transformations) from the data directly. • Analysts challenge: Deciphering the handwriting contained in the data • Chemical fingerprinting/source apportionment • Meteorological back-trajectory analysis • Dynamic modeling
Aerosols: Many Dimensions • Compared to gases (X, Y, Z, T), the aerosol system has four extra dimensions(D, C, F, M). • Spatial dimensions X, Y Satellites, dense networks • Height Z Lidar, soundings • Time T Continuous monitoring • Particle size D Size-segregated sampling • Particle Composition C Speciated analysis • Particle Shape/Form F Microscopy • Ext/Internal Mixture M Microscopy • Bad News:The mere characterization requires many tools. • Some tools sample a small subset of the xDim aerosol data space • These need extrapolation, e.g. single particle analysis • Other tools get integral measures of several dimensions • These require de-convolution of the integral, e.g. satellite sensors Satellite-Integral
Aerosols: Opportunity and Challenge • Good news: The aerosol system is self-describing. • Once the aerosol is characterized (size-composition, shape) and • Spatio-temporal pattern are established, • => The aerosol system describes much of its history through the properties and pattern, e.g source type (dust, smoke, haze), formation mechanisms, atmospheric interactions. and transformations. • The ‘aerosol’ dimensions (D, C, F, M) are most useful for establishing the sources and effects, including some of the processes. • The Source of can be considered an additional, ‘derived’ aerosol dimension. • Analysts challenge: Deciphering the handwriting contained in the data • Chemical fingerprinting/source apportionment • Meteorological transport analysis • Multidimensional data extrapolation, de-convolution and fusion
Local, Sahara and Gobi Dust over N. America • The dust over N. America originates from local sources as well as from the Sahara and Gobi Deserts • Each dust source region has distinct chemical signature in the crustal elements.
Seasonal and Secular Trends of Sahara Dust over the US Seasonally, dust peaks sharply in July when the Sahara plume swings into the Caribbean. Regional Sahara Dust events occur several times each summer
Sahara Dust Passage over the EUS (Poirot, 2003)Dirty dust composition based on Positive Matrix Factorization, PMF At Brigantine, NJ, dust composition is enriched by SO4 (30% dirty dust mass) and NO3 (8%) ‘Dirty’ dust and salt composition
NOAA ARL ATAD ATAD Traject Gebhart (2002) Weather Serv. Upper Air Data CATT Tool Husar (2003) Aggregation Poirot (2003) PMF Tool Pareto (2001) PMF “Sources” Coutant (2002) NPS-CIRA IMPROVEData Direction of Dust Origin at 5 IMPROVE Sites High ‘dust’ concentration at 5 sites indicate the same airmass pathway from the tropical Atlantic Ad hoc Data Processing Value Chain
The Influence of Emissions, Dilution and Transformations • The PM concentration, C, at any given location and time is determined by the combined interaction of emissions, E, atmospheric dilution, D, and chemical transformation and removal, T, processes: C = f (E, D, T) • Each of the three processes has its own pattern at secular, yearly, weekly, synoptic, diurnal and micro time scales. • The yearly, weekly and the diurnal scales are periodic
Seasonal Pattern of PM2.5 • The seasonal cycle results from changes in PM background levels, emissions, atmospheric dilution, and chemical reaction, formation, and removal processes. • Examining the seasonal cycles of PM2.5 mass and its elemental constituents can provide insights into these causal factors. • The season with the highest concentrations is a good candidate for PM2.5 control actions. Key reference: CAPITA
Seasonal PM2.5 During 1988 • At Washington DC and Philadelphia, (Mid-Atlantic) the PM2.5 concentrations are 60% higher in summer than in winter. • In the rural Appalachians, the summer PM2.5 concentrations are a factor of three higher than during the winter. • At urban Southwestern sites, PM2.5 concentrations in the winter are 50% higher than in the summer. • At rural Southwestern sites, PM2.5 concentrations are 50% higher during June than January. Key reference: CAPITA
Pattern of Fires over N. America The number of ATSR satellite-observed fires peaks in warm season Fire onset and smoke amount is unpredictable Fire Pixel Count: Western US North America
Asian Dust Cloud over N. America Asian Dust 100 mg/m3 Hourly PM10 On April 27, the dust cloud arrived in North America. Regional average PM10 concentrations increased to 65 mg/m3 In Washington State, PM10 concentrations exceeded 100 mg/m3
Origin of Fine Dust Events over the US Gobi dust in spring Sahara in summer Fine dust events over the US are mainly from intercontinental transport
Daily Average Concentration over the US Sulfate is seasonal with noise Noise is by synoptic weather Dust is seasonal with noise Random short spikes added VIEWS Aerosol Chemistry Database
Annual July The Sahara and Local dust was apportioned based on their respective source profiles. Sahara and Local Dust Apportionment: Annual and July • The maximum annual Sahara dust contribution is about 1 mg.m3 • In Florida, the local and Sahara dust contributions are about equal but at Big Bend, the Sahara contribution is < 25%. • In July the Sahara dust contributions are 4-8 mg.m3 • Throughout the Southeast, the Sahara dust exceeds the local source contributions by w wide margin (factor of 2-4)
Supporting Evidence: Transport Analysis Satellite data (e.g. SeaWiFS) show Sahara Dust reaching Gulf of Mexico and entering the continent. The air masses arrive to Big Bend, TX form the east (July) and from the west (April)
Seasonal Fine Aerosol Composition, E. US Smoky Mtn Upper Buffalo Everglades, FL Big Bend, TX
July 5, 1992 Much previous work by Prospero, Cahill, Malm, Scanning the AIRS PM10 and IMPROVE chemical databases several regional-scale PM10 episodes over the Gulf Coast (> 80 ug/m3) that can be attributed to Sahara. Sahara PM10 Events over Eastern US The highest July, Eastern US, 90th percentile PM10 occurs over the Gulf Coast ( > 80 ug/m3) Sahara dust is the dominant contributor to peak July PM10 levels. June 30, 1993 June 21 1997
May 9, 1998 A Really Bad Aerosol Day for N. America Asian Smoke Canada Smoke What kind of neighborhood is this anyway? C. American Smoke
Seasonal PM2.5 Dependence on Elevation in Appalachian Mountains Monitor Locations and topography • During August, the PM2.5 concentrations are independent of elevation to at least 1200 m. Above 1200 m, PM2.5 concentrations decrease. • During January, PM2.5 concentrations decrease between sites at 300 and 800 m by about 50% . PM2.5 concentrations are approximately constant from 800 m to 1200 m and decrease another ~50% from 1200 to 1700 m. Key reference:
Local, Sahara and Gobi Dust over N. America • The dust over N. America originates from local sources as well as from the Sahara and Gobi Deserts • Each dust source region has distinct chemical signature in the crustal elements.
Attribution of Fine Dust (<2.5mm) Local and Sahara • In Florida, virtually all the Fine Particle Dust appears to originate from Sahara throughout the year • At other sites over the Southeast, Sahara dominates in July • The Spring and Fall dust is evidently of local origin The two dust peeks at Big Bend have different Al/Si ratios During the year, Al/Si = 0.4 In July, Al/Si reaches 0.55, closer to the Al/Si of the Sahara dust (0.65-0.7) The spring peak is identified as as ‘Local Dust’, while the July peak is dominated by Sahara dust.
Supporting Evidence: Aerosol Pattern and Transport Analysis There are large seasonal differences in the directions that air masses arriving in Big Bend, TX have taken. During winter and into spring, they come from the west and the northwest,while during the summer, they come mainly from the east. • In July (1998) elevated levels of absorbing aerosol (Sahara Dust) reaches the Gulf of Mexico and evidently, enters the continent . • High TOMS dust levels are seen along the US-Mexican borders, reaching New Mexico. Higher levels also cover the Caribbean Islands and S. Florida. • Another patch of absorbing aerosol (local dust?) is seen over the Colorado Plateau, well separated from the Sahara dust.
Illustration of RAW: Quebec Smoke, July 6, 2002 Right. SeaWiFS satellite and METAR surface haze shown near-real time in the Voyager distributed data browser Below. SeaWiFS, METAR and TOMS Absorbing Aerosol Index superimposed Satellite data are fetched from NASA GSFC; surface data from NWS/CAPITA servers
CATT TAT CAPITA A E R O S O L CATT-In CAPITA Aerosol Sensors Aerosol Data Integrated AerData TrajData Cube Aggreg.Aerosol Next Process Collection IMP. EPA Trajectory ARL Integration VIEWS Assimilate NWS CATT CAT CAPITA Weather Data Gridded Meteor. Traject.Data When? Where? Aggreg. Traject. Next Process AerData Cube CATT-In CAPITA Why? How? T R A N S P O R T Analysis Value Chain: CATT’s Habitat
Transport Probability Metrics • The transport metric is calculated from two residence time grids, one for all trajectories and another for trajectories on selected (filtered days). Both residence time grids are normalized by the sum of all resdence times in all grid cells: pijf=rij/SS rij pija=rij/SS rij • pijf, is the filtered and pijais the unfiltered residence time probabilitiy that an airmasses passes through a specific grid. There is a choice of transport probaility metrics: • The Incremental Residence Time Probability (IRTP) proposed by Poirot et al., 2001 is obtained by subtracting the chemically filtered grid from the unfiltered residence time grid, IRTP = pijf - pija • The other metric is the Potential Source Contribution Function (PSCF) proposed by Hopke et al., 19xx which is the ratio of the filtered and unfiltered residence time probabilities, PSCF = pijf / pija
Transport Metric Selection • Currently, there is a choice of two different transport probability metrics: • Incremental Residence Time Probability (IRTP) proposed by Poirot et al., 2001 is the difference between the chemically filtered and unfiltered residence time probalbilities. Positive values of IRTP in a grid indicates more than average liekihood of transport; (red); negative IRTP values (blue) represent less than average likeihood of transport. • Potential Source Contribution Function (PSCF) proposed by Hopke et al., 19?? is computed as the ratio of the filtered and unfiltered residence time probabilities. Higher values of PSCF is indicative of inreased source contribution. • The desired metric is selected through a dialog box invoked by clicking on the right-most button in the TRAJ_CHEM layer.
SUMMARY • The atmospheric dust system occupies at least 8 key dimensions g (x, y, x, t, size, comp, shape, mixture) • The current observational revolution (satellites, surface networks) allows monitoring many aspects of the global daily aerosol pattern and transport. • Each sensor/system measures different aspects of aerosols, usually resolving some and integrating over other dimensions. • Data from multiple sensors/systems (satellites AND surface) along with models are required to characterize the 8D system and to derive actionable knowledge. • Current data and analysis tools allow the estimation of transcontinental transport of dust to N. America. • The yearly average fine (<2.5 um) Sahara dust concentration over the SE US is 0.2 – 1 ug/m3, with July peak concentration of 2-6 ug/m3. • During specific transcontinental dust transport episodes from Africa and Asia, the globally transported surface dust concentrations approach 50-100 ug.m3 over 1000 km - scale regions of North America. • These events constitute significant perturbations to the aerosol pattern of North America.
SUMMARY: New Opportunities • We are in the midst of a sensory revolution regarding the detection of global aerosol sources, transport and some of the effects. Satellite and surface network provide daily pattern of aerosol. • Still, the available aerosol data provides only a sparse characterization of the aerosol system. • The Internet facilitates communication and the sharing, (reuse) of data and tools. There is a growing collaborative-sharing spirit in the scientific community; The winds of change are here – but we need to harness them for faster learning • Establishing trans-continental source-receptor relationship for dust is attainable with available observational and modeling tools but will require: • Open flow of data/knowledge and sharing of tools • Creation of scientific ‘value-adding chains’ • Decomposition and reintegration of the 8D aerosol system
Combined Aerosol Trajectory Tool (CATT) Example: Airmass origin for high (2.5*average) nitrate Boundary Waters Doly Sods Lye Brook Smoky Mtn. Triangulation indicates nitrate source in the corn belt
AEROSOL CATT-In CAPITA Aerosol Sensors Aerosol Data Integrated AerData TrajData Cube Aggreg.Aerosol Collection IMP. EPA Trajectory ARL Integration VIEWS Assimilate NWS CATT Weather Data Gridded Meteor. Traject.Data When? Where? Aggreg. Traject. Next Process AerData Cube CATT-In CAPITA Not There! Why? How? TRANSPORT Further Analysis Next Process GIS Grid Processing Emission Comparison There! CATT: A Community Tool! Part of an Analysis Value Chain
Significant Natural Contributions to Haze by RPO Judged qualitatively based on current surface and satellite data WRAP Local Smoke Local Dust Asian Dust MANE-VU Canada Smoke • Natural forest fires and windblown dust are judged to be the key contributors to regional haze • The dominant natural sources include locally produced and long-range transported smoke and dust CENRAP Local Smoke Mexico/Canada Smoke Local Dust Sahara Dust MRPO Local Smoke Canada Smoke Local Dust VISTAS Local Smoke Sahara Dust
Dimension Abbr. Data Sources Spatial dimensions X, Y Satellites, dense networks Height Z Lidar, soundings Time T Continuous monitoring Particle size D Size-segregated sampling Particle Composition C Speciated analysis Particle Shape/Form F Microscopy Ext/Internal Mixture M Microscopy Scientific Challenge: Description of PM Particulate matter is complex because of its multi-dimensionality It takes at leas 8 independent dimensions to describe the PM concentration pattern • Gaseous concentration: g (X, Y, Z, T) • Aerosol concentration: a (X, Y, Z, T, D,C,F, M) • The ‘aerosol dimensions’ size D, composition C, shape F, and mixing M determine the impact on health, and welfare.
Technical Challenge: Characterization • PM characterization requires many different instruments and analysis tools. • Each sensor/network covers only a limited fraction of the 8-D PM data space. • Most of the 8D PM pattern is extrapolated from sparse measured data. • Some devices (e.g. single particle electron microscopy) measure only a small subset of the PM; the challenge is extrapolation to larger space-time domains. • Others, like satellites, integrate over height, size, composition, shape, and mixture dimensions; these data need de-convolution of the integral measures.
Now Analysis Days Predictive Analysis Days-years Retrospective Anal. Months-years Data Sources & Types All the Real-Time data + NPS IMPROVE Aer. Chem. EPA Speciation EPA PM10/PM2.5 EPA CMAQ Full Chem. Model EPA PM2.5Mass NWS ASOS Visibility, WEBCAMs NASA MODIS, GOES, TOMS, MPL NOAA Fire, Weather & Wind NAAPS MODEL Simulation NAAPS MODEL Forecast NOAA/EPA CMAQ? Data Analysis Tools & Methods Full chemical model simulation Diagnostic & inverse modeling Chemical source apportionment Multiple event statistics Spatio-temporal overlays Multi-sensory data integration Back & forward trajectories, CATT Pattern analysis Emission and met. forecasts Full chemical model Data assimilation Parcel tagging, tracking Communication Collab. & Coord. Methods Tech Reports for reg. support Peer reviewed scientific papers Science-AQ mgmt. interaction Reconciliation of perspectives Analyst and managers consoles Open, inclusive communication Data assimilation methods Community data & idea sharing Open, public forecasts Model-data comparison Modeler-data analyst comm. Analysis Products Quantitative natural aer. concr. Natural source attribution Comparison to manmade aer. Current Aerosol Pattern Evolving Event Summary Causality (dust, smoke, sulfate) Future natural emissions Simulated conc. pattern Future location of high conc. Decision Support Jurisdiction: nat./manmade State Implementation Plans, (SIP) PM/Haze Crit. Documents, Regs Jurisdiction: nat./manmade Triggers for management action Public information & decisions Statutory & policy changes Management action triggers Progress tracking Data Analysis and Decision Support
July 2020 Quebec Smoke Event – Superposition of ASOS visibility data (NWS) and SeaWiFS reflectance data for July 7, 2002 • PM2.5 time series for New England sites. Note the high values at White Face Mtn. • Micropulse Lidar data for July 6 and July 7, 2002 - intense smoke layer over D.C. at 2km altitude.
GLAS Satellite Lidar(Geoscience Laser Altimeter System)First satellite lidar for continuous global observations of Earth California Fires, Oct 7, 2003
2002 Quebec Smoke over the Northeast Smoke (Organics) and Sulfate concentration data from VIEWS integrated database DVoy overlay of sulfate and organics during the passage of the smoke plume