Download
1 / 1
10 likes | 137 Views
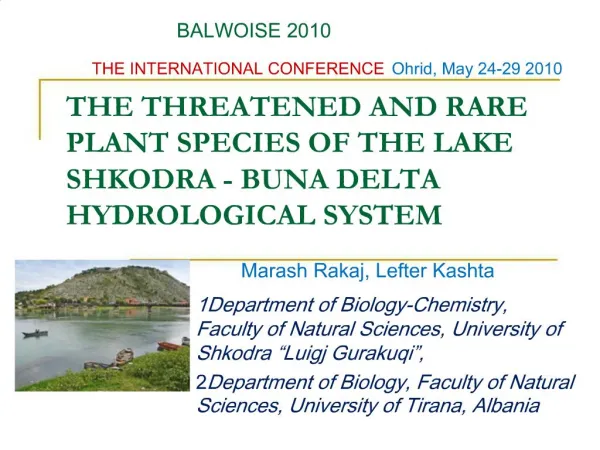
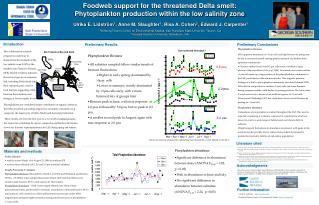
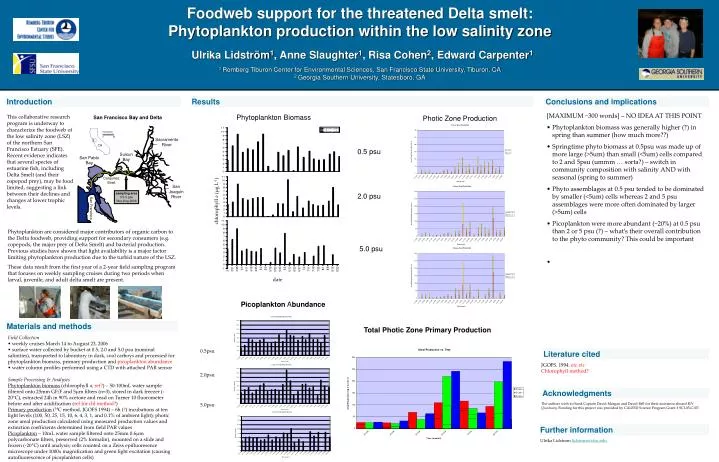
Foodweb support for the threatened Delta smelt: Phytoplankton production within the low salinity zone Ulrika Lidström 1 , Anne Slaughter 1 , Risa Cohen 2 , Edward Carpenter 1 1 Romberg Tiburon Center for Environmental Sciences, San Francisco State University, Tiburon, CA

E N D
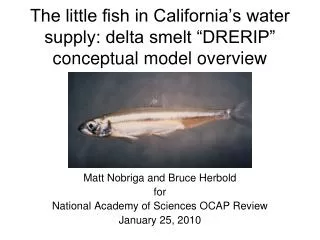
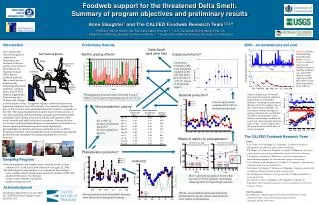
Foodweb support for the threatened Delta smelt: Phytoplankton production within the low salinity zone Ulrika Lidström1, Anne Slaughter1, Risa Cohen2, Edward Carpenter1 1 Romberg Tiburon Center for Environmental Sciences, San Francisco State University, Tiburon, CA 2 Georgia Southern University, Statesboro, GA 0 20 San Francisco Bay and Delta Kilometers Sacramento River CA San Pablo Bay Suisun Bay Carquinez Strait San Joaquin River sampling area 0.5-5 psu Mar-Aug 2006 San Francisco Introduction Results Conclusions and implications This collaborative research program is underway to characterize the foodweb of the low salinity zone (LSZ) of the northern San Francisco Estuary (SFE). Recent evidence indicates that several species of estuarine fish, including Delta Smelt (and their copepod prey), may be food limited, suggesting a link between their declines and changes at lower trophic levels. • [MAXIMUM ~300 words] – NO IDEA AT THIS POINT • Phytoplankton biomass was generally higher (?) in spring than summer (how much more??) • Springtime phyto biomass at 0.5psu was made up of more large (>5um) than small (<5um) cells compared to 2 and 5psu (ummm … sorta?) – switch in community composition with salinity AND with seasonal (spring to summer) • Phyto assemblages at 0.5 psu tended to be dominated by smaller (<5um) cells whereas 2 and 5 psu assemblages were more often dominated by larger (>5um) cells • Picoplankton were more abundant (~20%) at 0.5 psu than 2 or 5 psu (?) – what’s their overall contribution to the phyto community? This could be important Phytoplankton Biomass Photic Zone Production 0.5 psu 2.0 psu chlorophyll a (µg L-1) Phytoplankton are considered major contributors of organic carbon to the Delta foodweb, providing support for secondary consumers (e.g. copepods, the major prey of Delta Smelt) and bacterial production. Previous studies have shown that light availability is a major factor limiting phytoplankton production due to the turbid nature of the LSZ. These data result from the first year of a 2-year field sampling program that focuses on weekly sampling cruises during two periods when larval, juvenile, and adult delta smelt are present. 5.0 psu date Picoplankton Abundance Materials and methods Total Photic Zone Primary Production • Field Collection • weekly cruises March 14 to August 23, 2006 • surface water collected by bucket at 0.5, 2.0 and 5.0 psu (nominal salinities), transported to laboratory in dark, cool carboys and processed for phytoplankton biomass, primary production and picoplankton abundance • water column profiles performed using a CTD with attached PAR sensor • Sample Processing & Analyses • Phytoplankton biomass (chlorophyll a, ref?) – 50-100mL water sample filtered onto 25mm GF/F and 5µm filters (n=3), stored in dark freezer (-20°C), extracted 24h in 90% acetone and read on Turner 10 fluorometer before and after acidification (ref for chl method?) • Primary production (14C method, JGOFS 1994) – 6h (?) incubations at ten light levels (100, 50, 25, 15, 10, 6, 4, 3, 1, and 0.1% of ambient light); photic zone areal production calculated using measured production values and extinction coefficients determined from field PAR values • Picoplankton – 10mL water sample filtered onto 25mm 0.6µm polycarbonate filters, preserved (2% formalin), mounted on a slide and frozen (-20°C) until analysis; cells counted on a Zeiss epifluoresence microscope under 1000x magnification and green light excitation (causing autofluorescence of picoplankton cells) 0.5psu 2.0psu 5.0psu Literature cited JGOFS. 1994. etc etc Chlorophyll method? Acknowledgments The authors wish to thank Captain David Morgan and David Bell for their assistance aboard R/V Questuary. Funding for this project was provided by CALFED Science Program Grant # SCI-05-C107. Further information Ulrika Lidstrom lidstrom@sfsu.edu