Download
1 / 16
230 likes | 571 Views
CONTROLS IN FOOD PRODUCTION. PRODUCTION SCHEDULES STANDARD RECIPES PORTION CONTROL YIELD % AND FACTORS OVER- AND UNDERPRODUCTION DAILY vs. TO-DATE COGS POTENTIAL SAVINGS. PRODUCTION. Management’s job regarding production mirrors its job in every other aspect of the operation:

E N D
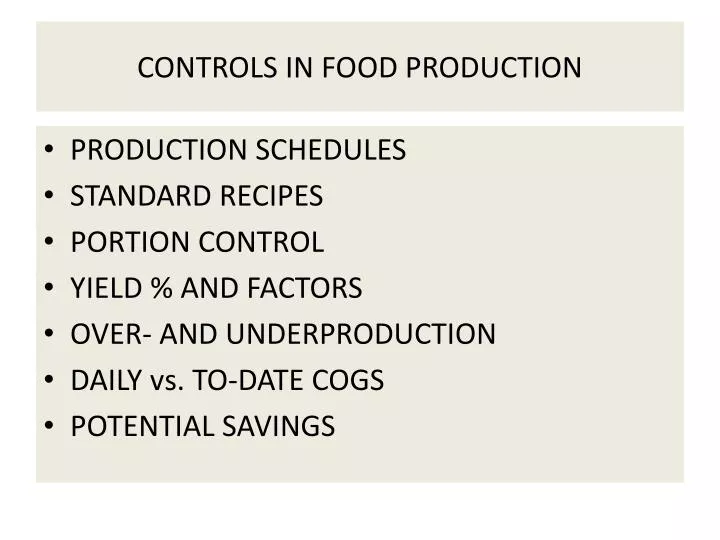
CONTROLS IN FOOD PRODUCTION • PRODUCTION SCHEDULES • STANDARD RECIPES • PORTION CONTROL • YIELD % AND FACTORS • OVER- AND UNDERPRODUCTION • DAILY vs. TO-DATE COGS • POTENTIAL SAVINGS
PRODUCTION Management’s job regarding production mirrors its job in every other aspect of the operation: Set the standards Monitor continually Reconcile any differences Address causes
PRODUCTION SCHEDULES What must be prepped for the upcoming shift? Popularity Index = $Item Sales/$Total Sales $Projected Sales = $Total Sales Forecast x Popularity Index Determine what you must add to inventory to be ready: Par Stocks – Inventory = Prep List
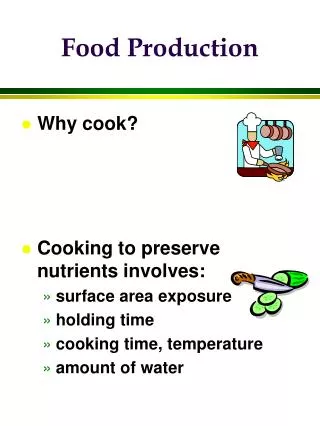
STANDARDIZING PRODUCTION STANDARDIZED RECIPES -Consistent taste and quality -Consistent cost -Facilitates cost/price adjustments as market prices fluctuate STANDARD PORTION SIZE -Various ways to standardize portions: -Volume: scoops, ladles, individual containers -Count: one each, two each, etc. -Weight: pre-portioned steaks, burgers, etc. STANDARD PORTION COSTS Standard Portion Cost = Purchase Price Per Unit / Portions per Unit
RECONCILIATIONForecast vs. Actual Under- production: Product mix may need revision Portions too large Pilferage/spoilage Failure to follow recipe Poor yield How were extras produced? Over Production Portions too small Can excess be reussed? Allocate waste to responsible shift
BUTCHER’S YIELD Meat is usually the highest priced item on the menu. Make vs. Buy Decision Price Available Skills Prep Space Use of By-Products
CALCULATING THE MULTIPLIER Primal Beef 30# Cost $10.00/# Total Cost $300.00 Butcher’s Yield: Value of Usable Bi Products $20.23 Hamburger Stew Beef Prime Rib Cost $300-$20.23 $279.77 Prime Rib Wt. 17# 8oz. Prime Rib $/# $15.98 Trimmed Price $15.98 = 1.6 Multiplier Original Pur. Price $10.00
Using the Multiplier As prices change, the multiplier is used in the Make vs. Buy decision. Whole Chicken Prices: Breast Prices: $1.19 $1.19 x 1.46 = $1.74 $1.39 $1.39 x 1.46 = $2.03 If whole chickens are selling for $1.39, and pre-cut breasts are selling for $2.03, pre-cut may be the better buy. Other considerations: Doesn’t account for fluctuations in the whole product (i.e. breast size vs. total bird) Prices of usable bi-products may vary
TOTAL COST APPROACH All bi-products are written off to the main item. Legs, thighs, wings, etc. are valued at $.00. Drives up the cost of the main item. Dramatically reduces cost of any dish made with bi-products Across the full-menu, COGS will even out.
COOKING LOSS TEST Can be used on primal or pre-cut items Divide the “after cooking” price per pound by the original price to determine the multiplier. Original Wt. 15 pounds Prime Rib per pound $15.00 After Cooking Wt. 12 pounds New Cost per Pound $18.75 Multiplier 1.25
STANDARD PORTION SIZE Used to establish menu prices Used to determine purchase quantity Used to forecast sales Used to provide consistent customer satisfaction
FOOD COST TODAY vs FOOD COST TO-DATE Operations that use high tech POS systems tied into Perpetual Inventory systems can look at COGS by hour, shift and day. short timeframes & low volume = great fluctuation This should be used in conjunction with a “moving COG” that adds in prior periods. longer timeframe & larger volume = consistent figures