Download
1 / 8
80 likes | 150 Views
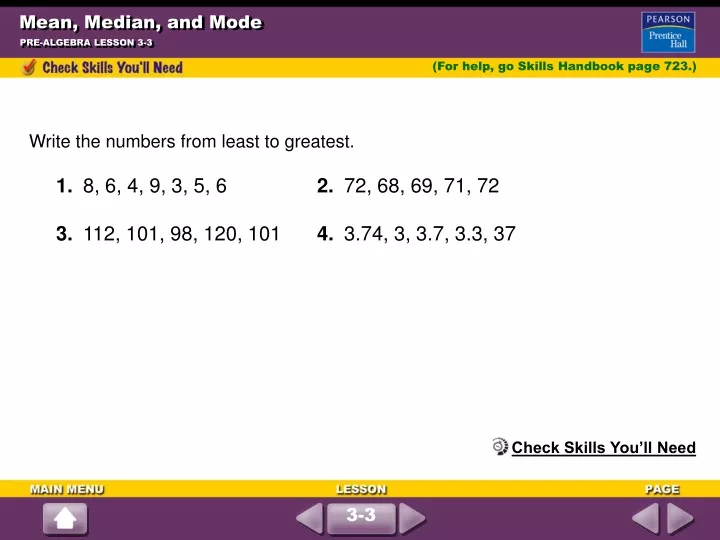
Mean, Median, and Mode. PRE-ALGEBRA LESSON 3-3. (For help, go Skills Handbook page 723.). Write the numbers from least to greatest. 1. 8, 6, 4, 9, 3, 5, 6 2. 72, 68, 69, 71, 72 3. 112, 101, 98, 120, 101 4. 3.74, 3, 3.7, 3.3, 37. Check Skills You’ll Need. 3-3.

E N D
Mean, Median, and Mode PRE-ALGEBRA LESSON 3-3 (For help, go Skills Handbook page 723.) Write the numbers from least to greatest. 1. 8, 6, 4, 9, 3, 5, 6 2. 72, 68, 69, 71, 72 3. 112, 101, 98, 120, 101 4. 3.74, 3, 3.7, 3.3, 37 Check Skills You’ll Need 3-3
Mean, Median, and Mode PRE-ALGEBRA LESSON 3-3 Solutions 1. 3, 4, 5, 6, 6, 8, 9 2. 68, 69, 71, 72, 72 3. 98, 101, 101, 112, 120 4. 3, 3.3, 3.7, 3.74, 37 3-3
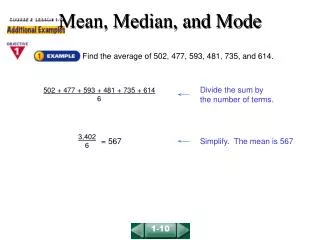
sum of data values number of data values 40 + 45 + 48 + 50 + 50 5 = = = 46.6 233 5 Mean, Median, and Mode PRE-ALGEBRA LESSON 3-3 Six elementary students are participating in a one-week Readathon to raise money for a good cause. Use the graph. Find the (a) mean, (b) median, and (c) mode of the data if you leave out Latana’s pages. a. Mean: The mean is 46.6. 3-3
40 45 48 50 50 Write the data in order. Mean, Median, and Mode PRE-ALGEBRA LESSON 3-3 (continued) b. Median: The median is the middle number, or 48. c. Mode: Find the data value that occurs most often. The mode is 50. Quick Check 3-3
77 6 12.8 Find the mean with the outlier. 44 5 8.8 Find the mean without the outlier. Mean, Median, and Mode PRE-ALGEBRA LESSON 3-3 Use the data: 7%, 4%, 10%, 33%, 11%, 12%. a. Which data value is an outlier? The data value 33% is an outlier. It is an outlier because it is 21% away from the closest data value. b. How does the outlier affect the mean? 12.8 – 8.8 = 4 The outlier raises the mean by about 4% points. Quick Check 3-3
Mean, Median, and Mode PRE-ALGEBRA LESSON 3-3 Which measure of central tendency best describes each situation? Explain. a. the monthly amount of rain for a year Mean; since the average monthly amount of rain for a year is not likely to have an outlier, mean is the appropriate measure. When the data have no outliers, use the mean. b. most popular color of shirt Mode; since the data are not numerical, the mode is the appropriate measure. When determining the most frequently chosen item, or when the data are not numerical, use the mode. 3-3
Mean, Median, and Mode PRE-ALGEBRA LESSON 3-3 (continued) c. time student leaves home to get to school Median; since a few students may leave much earlier or much later than most of the students, the median is the appropriate measure. When an outlier may significantly influence the mean, use the median. Quick Check 3-3
Mean, Median, and Mode PRE-ALGEBRA LESSON 3-3 Which measure of central tendency best describes each situation? 1. numbers of legs on the animals in a zoo 2. favorite digits (from 0 to 9) of the students in a class 3. numbers of days-per-student that students are absent from school 4. test scores mode mode median mean 3-3