Download
1 / 36
360 likes | 365 Views
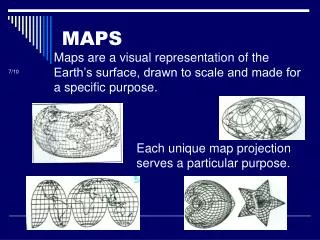
Clickable Maps. Choropleth Map - A thematic map in which ranked classes of some variable are depicted with shading patterns or colors for predefined zones (categories).

E N D
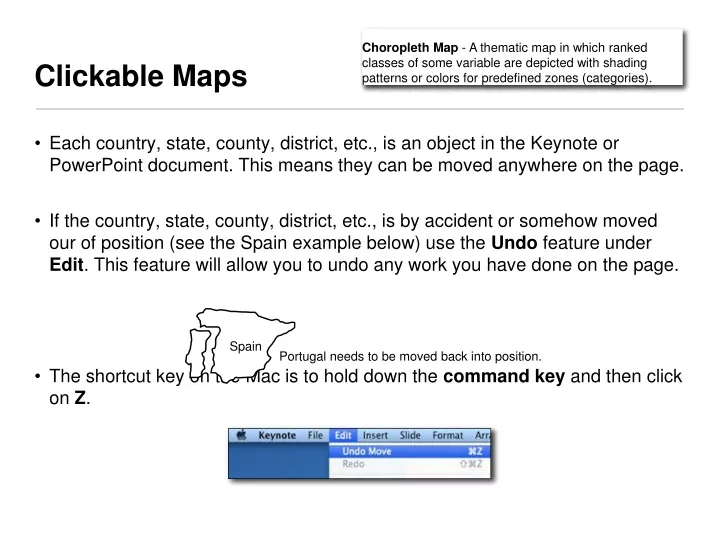
Clickable Maps Choropleth Map - A thematic map in which ranked classes of some variable are depicted with shading patterns or colors for predefined zones (categories). • Each country, state, county, district, etc., is an object in the Keynote or PowerPoint document. This means they can be moved anywhere on the page. • If the country, state, county, district, etc., is by accident or somehow moved our of position (see the Spain example below) use the Undo feature under Edit. This feature will allow you to undo any work you have done on the page. • The shortcut key on the Mac is to hold down the command key and then click on Z. Spain Portugal needs to be moved back into position.
Use Shades of Similar Colors Step 1 Step 2 Step 3 From Fill select the color for the state. Click once on the state. The state will turn into the color selected. Selecting colors for the Choropleth Map
Statistics needed for Choropleth map.
Name: • Choropleth Mapping Activity • Select statistics for the United States on any topic that was covered during the first nine weeks. • Compete a histogram for the statistics. • Using the completed histogram determine between 4 and 6 categories for the data. • Using the map from the Keynote document construct a map for the statistics. • Make sure the map has the following items: Title, Date, Source, Legend, and Border. The color scheme for the map should go from dark to light of similar colors. Histogram for Number of People Per Starbucks, 2008 15 Number of States 10 5 0 120,000 150,000 30,000 60,000 90,000 Number of People Per Starbucks Coffee
Starbucks Coffee Per Capita, 2008 Number of People Per Starbucks Less Than 30,000 30,000 - 59,999 N 60,000 - 89,999 90,000 - 119,999 120,000 - 149,999 150,000 + Sources: startucks.com and U.S. Census Bureau Name:: Michael Robinson
http://www.statistik-portal.de/Statistik-Portal/en/en_jb01_jahrtab1.asphttp://www.statistik-portal.de/Statistik-Portal/en/en_jb01_jahrtab1.asp
Student Name:_____________________________________________ Class Period:____________ Date:_____________ HISTOGRAM graph directions 1- Use the web site, www.statistik-portal.de/Statistik-Portal/en, to find the statistics for the histogram. Write the topic of the statistics in box A, and write its value in box B. 2- Complete the histogram by writing in the name for each of the sixteen German states in the appropriate box. 3- Use the completed histogram to determine 4 or 5 categories for the statistical data. 4- Use the clickable German map from the PowerPoint (PC) or the Keynote (Mac) document to construct your Chororpleth map. Make sure the map has the following items: TItle, Date, Source, Legend, and Border. The color scheme should be from dark to light of similar colors, e.g., dark blue to light blue. 10 Number of German States 5 0 5 10 15 20
Population for Germany’s States, 2008 Population in Millions 15 Million + 10 Million - 14,999,999 Million 5 Million - 9,999,999 Million Less Than 5 Million Source: http://www.statistik-portal.de/Statistik-Portal/en/en_jb01_jahrtab1.asp Student Name:_______________________________________________________
Population for Germany’s States, 2008 Population in Millions 15 Million + 10 Million - 14,999,999 Million 5 Million - 9,999,999 Million Less Than 5 Million Source: http://www.statistik-portal.de/Statistik-Portal/en/en_jb01_jahrtab1.asp
TITLE, date Title for Legend Category 1 Category 2 Category 3 Category 4 Category 5 Source
Student Name:_____________________________________________ Class Period:____________ Date:_____________ HISTOGRAM graph directions 1- Use the web site, www.statistik-portal.de/Statistik-Portal/en, to find the statistics for the histogram. Write the topic of the statistics in box A, and write its value in box B. 2- Complete the histogram by writing in the name for each of the sixteen German states in the appropriate box. 3- Use the completed histogram to determine 4 or 5 categories for the statistical data. 4- Use the clickable German map from the PowerPoint (PC) or the Keynote (Mac) document to construct your Choropleth map. Make sure the map has the following items: TItle, Date, Source, Legend, and Border. The color scheme should be from dark to light of similar colors, e.g., dark blue to light blue. 10 Number of German States 5 0 Student Handout
http://www.statistik-portal.de/Statistik-Portal/en/en_jb01_jahrtab1.asphttp://www.statistik-portal.de/Statistik-Portal/en/en_jb01_jahrtab1.asp