Download
1 / 33
330 likes | 457 Views
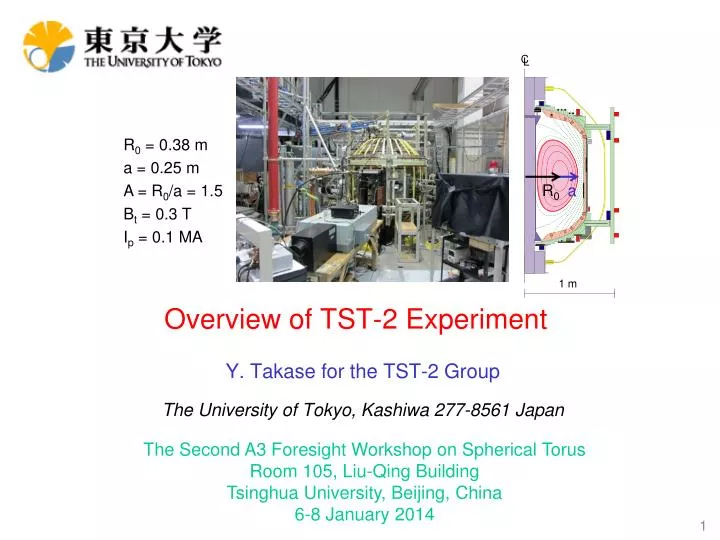
R 0 = 0.38 m a = 0.25 m A = R 0 /a = 1.5 B t = 0.3 T I p = 0.1 MA . Overview of TST-2 E xperiment. Y . Takase for the TST-2 Group The University of Tokyo, Kashiwa 277-8561 Japan. R 0. a. The Second A3 Foresight Workshop on Spherical Torus Room 105, Liu-Qing Building

E N D
R0 = 0.38 m a = 0.25 m A = R0/a = 1.5 Bt= 0.3 T Ip = 0.1 MA Overview of TST-2 Experiment Y. Takase for the TST-2 Group The University of Tokyo, Kashiwa 277-8561 Japan R0 a The Second A3 Foresight Workshop on Spherical Torus Room 105, Liu-Qing Building Tsinghua University, Beijing, China 6-8 January 2014
Motivation and Goal of Research • Economically competitive tokamak reactor may be realized at low aspect ratio (A = R0/a) by eliminating the central solenoid (CS) CS no CS higher Bt lower A higher bt S. Nishio, et al., in Proc. 20th IAEA Fusion Energy Conf., FT/P7-35 (Vilamoura , 2004).
Noninductive ramp-up(LH) Transition to self-driven phase Start-up and initial ramp-up 2002.06.21 • Formation of Advanced Tokamak Plasma without CS was Achieved on JT-60U • Is plasma current (Ip) ramp-up by LHW possible in ST? Demonstrate on TST-2 advanced tokamak S. Shiraiwa, et al., Phys. Rev. Lett. 92 (2004) 035001.
Three Antennas used on TST-2 Grill Antenna ComblineAntenna ECC Antenna traveling wave traveling wave traveling wave • excites traveling FW • Ip driven by SW (LHW) • requires mode conversion • from FW to SW • excites traveling SW • excites traveling SW • sharper k spectrum • & higher directivity
n|| Dependence of Ip and HX Spectrum(Grill Antenna) [kA] • Highest plasma current was obtained for 1.5 < n|| < 4.5 • Count rate of high energy photons was lower when n|| > 7.5 n|| T. Wakatsuki
Calculated Electric Field (Ez) Ez (Without Plasma) T. Inada
Ramp-up to 12 kA by LHW(ECC Antenna) Bt Bv Ip limiter nel FWD REF trans LCFS ECH #2 #4#6#9 AXUV Ha TST-2 Shot 98362 T. Shinya
Scaling of Ip with Bv and Bt co-drive counter-drive • Ip increases with Bv . • Upper bound of Ipincreases with Bt. T. Shinya
Scaling of Ip with PRF and ne 1 A/W • Higher Ipis obtained with ECCA for the same PRF . • Higher neis obtained with ECCA. T. Shinya
Comparison of the Current Drive Figure of Merit ηCDvs IP ηCD [1016 A/m2/W ] : plasma current : average electron density : major radius : RF power IP [kA] • Higher hCD is obtained with ECCA (mainly because of higher ne). • An order of magnitude improvement in hCD may be possible by suppression of edge wave power loss and fast electron loss • operation at higher Bt, ne, Ip , PRF, Te should help. T. Wakatsuki
Hard X-ray Spectra for Co/Ctr Current Drive Directions(Combline Antenna) HX view ctr Ip co wave HX view antenna • Photon flux is an order of magnitude higher in the co direction. • Photon temperature is higher in the co direction (60 keV vs. 40 keV). • Consistent with acceleration of electrons by a uni-directional RF wave. T. Wakatsuki
Hard X-ray Spectra for Co/Ctr Current Drive Directions(ECC Antenna) [kA] Ctr [1/m^3] Co 17 2 [ms] 1.5 Ch1 1.0 0.5 0 Ch2 [a.u.] [j/m^2] [ms] ■:Ch1,Co ▲:Ch2,Ctr …SBD PP __ SBD Be SBD Be&SBD P.P Similar co and counter “temperatures”, but co flux is larger than counter flux. Analysis section [ms] K. Imamura [keV] E
Radial Profile of the Floating Potential (Combline Antenna) ・Floating potential (where Iprobe = 0) is sensitive to the presence of high energy electrons. Limiter 3 LCFS antenna wave 1 6 7 5 R=125 mm probe R= 585 mm R=700 mm 9 mm 5.6 mm 5.7 mm ・Vf has a large gradient near the limiter radius. H. Kakuda
Ion Temperature, Toroidal Flow and Poloidal Flow(Grill Antenna, Ip ~ 6kA) Right sightline Left sightline Ip Bt Upper sightline Lower sightline S. Tsuda
One-Fluid Equilibrium (EFIT) Reconstructed equilibrium Ip = 11 kA bp = 0.9 current density profile peaked on the outboard side Visible light image A. Ejiri
Two-Fluid Equilibrium (Initial Result) TST-2 Shot 75467 • Plasma pressure max ~40 Pa (?) • Peaked toroidal current distribution (?) • What is plasma sound speed? • Large Er shear ion orbit compression • Electron: largely satisfies pe = -JB • Ion (outboard): roughly equal pi, centrifugal, and electrostatic forces balanced by-JB M. Peng & A. Ishida
Floating Potential Measurement at 200 MHz :ES Probe with Embedded High Impedance Resistor 1 2 5 Chip resistor 100 kΩ 3 4 Absolute Value of Impedance [Ω] 105 Black solid line : Electrostatic Probe with a 100 kΩ Chip Resistor 104 1 2 Green solid line : Ordinary Langmuir Probe 5 Electrode 1, 2, 3 ・・・ With 100 kΩ Electrode 4 ・・・ Magnetic Probe Electrode 5 ・・・ Ordinary Langmuir Probe 3 4 103 Red broken line : Sheath impedance H. Kakuda 0.1 [MHz] 1 10 100 1000
Phase Difference and Wavenumber Measurement Electrode Separation 14.2mm 1 2 3 H. Kakuda
Frequency Spectra Measured by RF Magnetic Probes(Combline Antenna) pump toroidal poloidal lower sideband • Combline antenna excites the FW, but LHW generated by PDI? • Pump wave (f = 200 MHz ± 1 kHz) has FW polarization (|Bt| > |Bp|). • PDI sidebands have SW (LHW) polarization (|Bt| < |Bp|). • Pump wave weakens when sidebands intensify. upper sideband T. Shinya
RF Magnetic Probe Array for k Measurement(Grill Antenna, ~ 1kA) • Array can be rotated about its axis • to distinguish RF polarization • to measure wavevector components • Dominant kcomponents excited by the antenna are kt 50 m-1, kp 10 m-1. • Measured kt≲ 10 m-1 is much smaller (higher kt absorbed?) a 30 mm b (= 0°) (= 90°) e d c rotation radial translation k||= 10 m-1 corresponds to n||= 2.4 T. Shinya
TST-2 Double-Pass Thomson Scattering System Plasma YAG laser Nd:YAG laser 1064nm Laser energy: 1.6 [J] Repetition rate: 10 [Hz] Pulse width: 10 [ns] [2nd pass] Brewster Window P|| B Nd:YAG Laser ~6m TST-2 TST-2 Scattering Vector Beam Dump Spherical Mirror Optical isolator [1st pass] B Incident Laser Spherical Mirror P⊥ Lens • Laser beam is focused in the plasma by a lens (f = 2000mm). • Optical isolator is used to prevent laser damage by reflected light. Polychromator Spherical Mirror Observer J. Hiratsuka
Typical ne and Teprofiles (OH Plasma) Thomson scattering Interferometer neL time slice neL [1018 m-2] ne [1019m-3] ne profile Timing of TS measurement • Comparison with interferometer • Thomson: 5.7 × 10¹⁸ [m-2] • Interferometer: 4.9 × 10¹⁸ [m-2] Te [eV] Te profile reasonable agreement Major Radius [mm] J. Hiratsuka
Electron Temperature Anisotropy (OH Plasma) R=220mm (plasma edge) R=389mm (plasma center) Assuming Maxwellian velocity distribution, current densities are: plasma edge: 300kA/m2plasma center: 500kA/m2 (plasma current / plasma cross section ~ 300kA/m2) J. Hiratsuka
Time evolution of electron temperature Center Evolution of Teanisotropy Center of Plasma → Cooling Edge TST-2 Edge of Plasma → Heating Central and edge Te approach each other K. Nakamura
Half-wave plate Multi-Pass Thomson Scattering Polarizer f = 2500 mm Mirror #1 Laser pulse is confined between concave mirrors (red line) TST-2 Pockels Cell f = 2000 mm Mirror #2 YAG Laser Brewster Window H. Togashi
Probe System for Turbulence Study tip1 tip2 tip3 Global mode 30mm Jdown Plasma flow, magnetic field, potential, and density fluctuations are measured simultaneously. Jup Nonlinear energy transfer direction Micro-turbulence coil1 zonal flow coil2 location 3-axis pickup coil Bt, Ip M. Sonehara
Poloidal Flow and Stresses • Poloidal flow and radial derivative of stress (Te=Ti is assumed). • Profiles of poloidal flow and stress derivative are similar. M. Sonehara
RogowskiProbe Langmuir probe Rogowski coil 3-D pick up coil Rogowski coil for measuring the local current was developed. 1-D pickup coil H. Furui
Successful Measurement of Local Current(OH Plasma) • Plasma current • Local plasma current density • Poloidalmagnetic field generated • by the plasma current ・ Bp is estimated to be under 20 mT at the location of the Rogowskicoil. ・ Output voltage of the Rogowski coil due to Bp is estimated to be under 100 μV. Local current measurement was performed successfully with small pickup of magnetic fields. H. Furui
Conclusions • ST plasma initiation and Ip ramp-up by waves in the LH frequency range were demonstrated on TST-2. • Inductively-coupled combline antenna (FW launch), dielectric-loaded waveguide array (“grill”) antenna (SW launch), and electrostatically-coupled combline antenna (SW launch) were used. • Spontaneous formation of the tokamak configuration with closed flux surfaces was observed when the toroidal current in the open field line configuration exceeded a critical level (~ 1 kA in TST-2). • Similar Ipwas obtained with different antennas for similar Bv and PRF, but hCD is higher with the ECC antenna because of higher ne. • At low Ip ( < 2 kA in TST-2), Ip is dominantly pressure-driven, and is proportional to Bv. In this regime, Ip is independent of the wave type. At higher Ip (> 5 kA in TST-2), Ipbecomes mainly wave-driven. In this regime, control of the current density profile by externally excited waves should become possible.
Conclusions • Various diagnostics and RF launchers are being developed. • Electrostatically-coupled combline antenna (LHW launch). • Hard X-ray spectroscopy and imaging. • UV spectroscopy for ion temperature and flow measurements. • Electrostatic probes for wave and turbulence measurements. • Magnetic probes for wave and current density measurements. • Double-pass Thomson scattering for Te anisotropy measurement. • Two-fluid equilibrium.
Need for Power Supply Upgrade In order to demonstrate ramp-up to higher Ip, power supply upgrade is needed to sustain higher Bt(~ 0.3 T) for longer time (> 0.1 s). 32
Near-Future Plans • Coil Power Supply Upgrade • Sustained high field (Bt = 0.3 T for > 0.1 s) for further Ip ramp-up. • Wave/Turbulence Diagnostics • Electrostatic probe array • Reflectometer / interferometer-polarimeter • Plasma diagnostics • Multi-pass Thomson scattering • EBW emission • Current profile measurement by Rogowski probe / magnetic probe • Ion flow measurement