Download
1 / 29
290 likes | 424 Views
Service Level Benchmarking. Workshop on Sustainable and Disaster Resilient Urban Development 9 th September, 2014. PAS Project. JNNURM: UWSS a priority. Largest urban infrastructure funding by GoI in 2005 through JnNURM with allocation of Rs. 66,000 crore

E N D
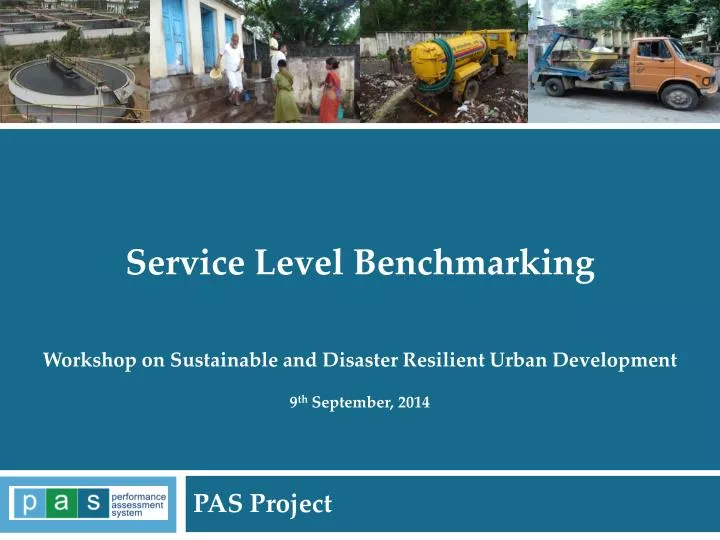
PAS Project • Service Level Benchmarking Workshop on Sustainable and Disaster Resilient Urban Development 9th September, 2014 PAS Project
JNNURM: UWSS a priority • Largest urban infrastructure funding by GoI in 2005 through JnNURM with allocation of Rs. 66,000 crore • Water sector accounted for largest share at 41%, withUWSS getting >70% of the funding • Good monitoring of project implementation – but need for better data on outcome or service delivery improvements Performance Assessment Systems Project
Need for performance information • Aggregate statistics suggest good coverage of water and sanitation in urban areas in India • BUT little is known about the quality, level and financial sustainability of service and only limited information on access of urban poorhouseholds to water and sanitation • Lack of WSS information leads to: • misallocation of resources and • it is difficult to assessimpact of past investments Need to move from Infrastructure funding to Improved service delivery
Past Efforts for UWSS Performance Assessment in India Utility data book sponsored by ADB and MoUD (2007) To provide baseline information for selected cities, initiate benchmarking and annual business planning • 28 Cities • (0.30 – 120 lakhs) CRISIL Advisory Services study sponsored by WSP (2003 – 2004) 20 cities: 15 M Corp, 2 city boards, 2 municipalities, and a private operator Awareness Generation & Status Assessment 13 utilities in Phase 1 and 16 utilities in Phase 2 NIUA study sponsored by CPHEEO (1999 – 2000) Status Assessment One time assessment of 300 Class I cities in India
Why Service Level Benchmarking ? • Different performance indicators under different initiatives • Varying definition or the assessment method • Externally driven initiatives • One time efforts and not institutionalised • Need to move from Measurement to Performance Improvement and Management
PAS Annual service delivery profile for 419 cities in 2States for 6 years Performance Assessment System National database for 1800 cities For 18 states for 3 years www.pas.org.in Water supply, Waste Water, Solid waste Management & Storm Water Old city area Newly developing colonies
Performance Monitoring Components of PAS project Performance Improvement Performance Measurement
Performance Measurement Activities in Gujarat and Maharashtra • SLB-PAS web portal– with data for 6 years for all ULBs – one of largest data bases on UWSS • On-line modules for measurement and target setting • Data collection through the State Level SLB cells established at GUDM, Government of Gujarat and at AIILSG, Government of Maharashtra • Compiled SLB indicators and target, gazetted, submitted to GoI.
Web based measurement and monitoring Shared data available at various levels Data entry: at city level Data storage: at state level State agencies, data and analysis Cities – data, results, analysis Citizens Access to analysis, results
PAS-SLB web portal: Online Data Entry Module • Layers of Approval • Data submitted by City staff • Approved by: Chief Officer /Commissioner, State officials • Guidebook • For online modules in local language
ULB level target setting model Target Model provides guidance for setting annual targets for SLB indicators – as per the 13th FC requirements. It helps to asses feasible targets base on trend analysis as well as ongoing capital works
Performance Monitoring Online City profile of all SLBs State profile of all SLBs Monitoring of data entry/ targets
Monitoring through State level dashboards PAS Project
Monitoring through City level dashboards PAS Project
Dashboards showing ranking of cities • Similar to human development index (HDI), urban development index (UDI) was calculated using 25 indicators identified under 4 dimensions: • Demography • Municipal services • Urban finance • Urban equity • The dashboard shows class-wise ranking as per the UDI value scored by a city. • The weightage for each dimension can be changed as and when required. • It also allows the user to locate the cities on the map to identify regions that are performing good or vice-versa.
Integrating SLB within NeGP • MMP for Municipalities • 35 JnNURM Cities as pilot • Development of e-Municipality application as a State Level Software Solution • 8 modules • core Service/management functions • Model guidelines suggested a State Level Software Solution (SLSS) • Not widely followed, but Odisha MMP RfP(Dec 2013) as a SLSS • Integrating with, and adding to, existing e-Municipality modules • Bhubaneshwar(Corp.) and Puri (Muni.) Grievances and Suggestions Property Tax, Utilities Bills Health Programs /SWM Personnel Information System NMMP Municipality Accounting System Birth/ Death Certificate Building Approvals Procurement and Monitoring
Integrating PAS-SLB within NeGP • National e-governance programme • Seizing the opportunity • Relatively early stage of e-Municipality roll out • Incorporate SLB as the 9thmodule? • Largely aggregation from the other 8 modules; easy to do • Assessment and Improvement tools • Faster compliance and state level monitoring • Dashboards, comparisons, ranking, social audit • Ushering in Performance linked grant regime • Develop both state and city level modules Grievances and Suggestions Performance assessment using SLB Property Tax, Utilities Bills Health Programs /SWM NMMP Municipality Personnel Information System Accounting System Birth/ Death Certificate Building Approvals Procurement and Monitoring
Integrating SLB in existing e-governance system of AMC Performance Assessment Systems (PAS) for Urban Water Supply and Sanitation in India
Enhancing e-Gov for SLB Mainstreaming - A Case of Kadi City Dashboard – Conceptual • Key Statistics • Property Tax • Water Supply • Waste Water • SWM • Storm Water • Street Light • Park- Garden • Road • Complaints • Birth-Death • Accounts • Revenue • Budget • Projects Property Tax Complaints Redressal Water Supply Revenue/ Accounts Street light Waste Water Solid Waste Management Roads
City Dashboard: Water Supply PERFORMANCE INDICATOR: WATER SUPPLY KADI 137 lpcd Narmada Bulk Water 91 out of 100 24% 100% 14.8 ML Daily Water Production 3.6 ML Daily water loss 1 1 Hr 70% 40% 30 7 Rs 1596 Cost per connection Rs 600 tariff per connection
Approach to performance improvement planning Conventional Approach PAS Approach ‘PROJECT’ based approach ‘SERVICE’ based approach Oriented towards OUTPUTS Oriented towards OUTCOMES SUPPLY DRIVEN Starting point is current performance – NEED DRIVEN Focus on INDIVIDUALPROJECTS Focus on SECTORAL SOLUTIONS Performance Assessment Systems (PAS) project, CEPT University, Ahmedabad
Integrated approach for SERVICE IMPROVEMENT PLANNING • Focus on moving away from ‘infrastructure investment plans’ to evolving ‘service improvement plans’ which include wide set of actions for improving service delivery. Multi-layered links between improvement actions and performance indicators, as against big singular project proposals … Regularize unauthorized connections Quality of water supply services Non-revenue water Coverage of water supply in slums Cost recovery of water supply services Coverage of water supply in city Improving service levels related to Access and coverage by varied set of interventions, rather than just infrastructure creation …
Integrated approach for FINANCIAL PLANNING Assess aggregate funding demand from all improvement actions Financial implications of each Improvement action Capital expenditure Revenue generation Operating and maintenance expenditure Effect of inflation based on phasing External sources of funds Exploring funding pattern possible for each improvement action Internal sources of funds Exploring options to increase revenue from own income sources Aligning both these financial streams to evolve sustainable ‘Financing Plan’ Assess financial health and extent of revenue surplus available Municipal finances of urban local bodies Past trends of municipal finances Forecasting for finances for Business as Usual scenario
Urban Sanitation Activities • PPP models • Developing Contracts • Governance & Regulation for FSM • Looking at technology options for waste treatment • Work at National level –NHB, GoI, other partners • Exploring Development Impact Bonds and City Sanitation fund • Links with HFI, MFI & SHGs, Corporate Social Responsibility • Moving away from community toilets Provide on-premise or group toilet • Options for toilet technology to reduce costs • Awareness and monitoring
Performance Improvement support • Support for development of Improvement Plans • 15 Class - A cities of Maharashtra to develop PIPs • Preliminary water audits in 10 cities of Gujarat • City Sanitation Plan in 4 small cities of Maharashtra • Information System Improvement Plan (ISIP) for Vadodara Municipal Corporation • Piloting Public Grievance Redressal System, cost recovery, services for the poor and drinking water quality surveillance in Gujarat
www.pas.org.in pas@cept.ac.in Thank You