Download
1 / 18
180 likes | 331 Views
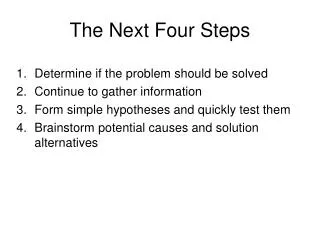
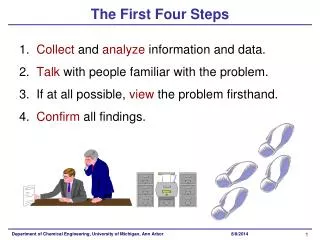
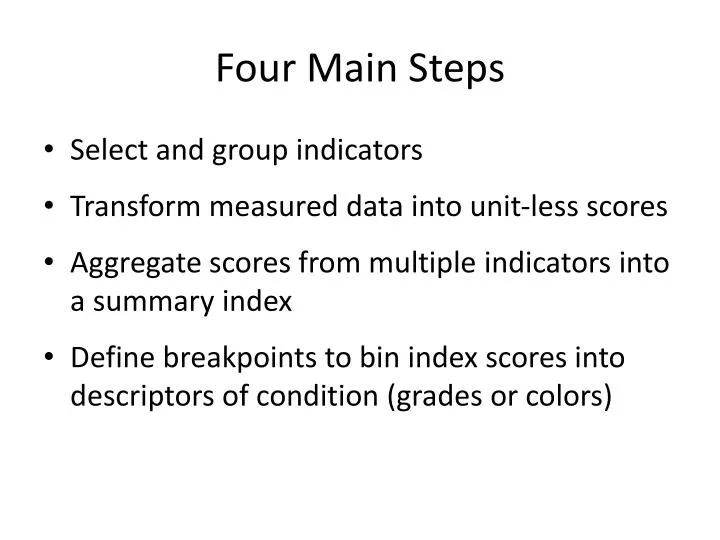
Four Main Steps. Select and group indicators Transform measured data into unit-less scores Aggregate scores from multiple indicators into a summary index Define breakpoints to bin index scores into descriptors of condition (grades or colors) . Central Coast Region Preliminary Indices.

E N D
Four Main Steps • Select and group indicators • Transform measured data into unit-less scores • Aggregate scores from multiple indicators into a summary index • Define breakpoints to bin index scores into descriptors of condition (grades or colors)
Central Coast RegionPreliminary Indices • Human Health WQ Index • Aquatic Life WQ Index • Toxicity Index • Bioassessment Index • Biostimulatory Risk Index • Habitat Index • Riparian Index
Scoring Approach Magnitude and Exceedance Quotient (MEQ) Combines two terms that express number of threshold exceedances and magnitude of exceendance. Derived from Canadian Ministry of Governments method
MEQ: modifications to CCME We are scoring all tests, not just failed tests. This provides a “good” end to the scoring tool We eliminated the scope term (how many analytes fail) because we have inconsistent data availability across sites. We do the calculations at the level of the analyte so that each analyte can also be scored
Calculating MEQ, cont. Calculate magnitude (amplitude) for each individual analyte (from CCME) Calculate unitless sample magnitudes: Magnitude = concentration/threshold Calculate normalized sum of magnitudes NSM = Σ magnitudes / sample count Scale from 0 – 100 = NSM / (0.01*magnitude average+0.01)
Calculating MEQ, cont. Combine exceedanceand magnitude factors and scale to 100 (modified from CCME) MEQ = 100 – √exceedance2 + magnitude2 1.414
Aggregating scores into an index • Basic water quality – Mean average • Biostimulation – Mean average • Metals for aquatic life – Harmonic Mean • Organic chemicals for aquatic life – worst score • Human health – worst score • Overall site score – Harmonic Mean or worse index score (?)
Threshold Selection • Assembled thresholds from Marshack, U.S. EPA benchmarks, and other sources • Established criteria for threshold selection • Marshack algorithms • Health not harm (“threshold” effects) • Consistency within chemical group • Selected thresholds for aquatic life (cold, estuarine, and marine) and human health (drinking water and water body contact) in sediment and water
Current Data Sources • CCAMP, SWAMP, Central Coast Ag data, Grant data • GAMA/Geotracker • Pesticide use database • Cadmus data layers • National land cover dataset
Index Development • Aquatic Life • Conventional water quality • Bioasssessment • Biostimulation (floating mats, chlorophyll a (water column • Organic chemistry (sediment and water) • Metals (sediment and water) • Hydrocarbons (sediment and water) • Toxicity (sediment and water)
Conventional Chemistry • pH departure • Water temperature • Nitrate • Total and unionized ammonia • Ortho-phosphate • Total suspended solids • Turbidity * Note currently no dissolved solids
Biostimulation • Oxygen departure • Chlorophyll a (water column) • % floating mats • NNE oxygen deficit • NNE predicted benthic chlorophyll biomass (using threshold of 44 mg/m2)
Human Health (includes drinking water and water body contact) • Salts • Nitrogen species • Organic chemicals • Hydrocarbons • Metals • Pathogen indicators
Canadian CCME WQ Index Factor 1: Scope Factor 2: Frequency Factor 3: Amplitude
Canadian CCME WQ Index, cont. CCME WQ Index Quadratic mean (or root mean square) gives greater weight to larger values, thus emphasizing excursions.
Canadian CCME WQ Index, cont. Pro: + widely excepted (esp. for drinking water) + considers scope, frequency, amplitude Con: - resolution to detect differences among sites or times depends heavily on standards selected - Not as useful for characterizing “healthy” because it only looks at failed tests - Scope is susceptible to site variability in number of analytes tested (best for very consistent study design)
Calculating MEQ Calculate rate of exceedance (frequency) for each individual analyte (from CCME) Factor 1: Frequency F1 F1