Download
1 / 47
470 likes | 604 Views
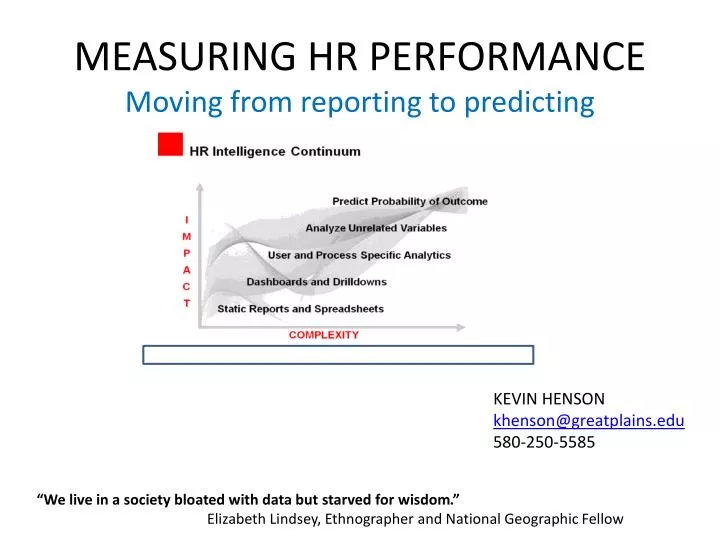
MEASURING HR PERFORMANCE Moving from reporting to predicting . KEVIN HENSON khenson@greatplains.edu 580-250-5585. “We live in a society bloated with data but starved for wisdom .” Elizabeth Lindsey, Ethnographer and National Geographic Fellow. 1st Premise .

E N D
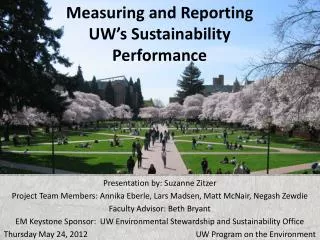
MEASURING HR PERFORMANCEMoving from reporting to predicting KEVIN HENSON khenson@greatplains.edu 580-250-5585 “We live in a society bloated with data but starved for wisdom.” Elizabeth Lindsey, Ethnographer and National Geographic Fellow
1st Premise Successful organizations must achieve: Operational Effectiveness – Is your organization performing similar activities better than your competitors? Strategic Positioning – What actions can your organization take to distinguish itself from competitors? What does your organization consider to be its competitive differentiators in the marketplace? Porter, M. (1996, November–December). What is strategy? Harvard Business Review, 74(6), 61–78.
HR can and should be both operational and strategic Vision 2nd Premise Business Strategy Organizational Strategy Strategic HR increases an organization’s ability to achieve its vision, mission and strategic objectives. This is done by developing (not in a vacuum) HR strategies (initiatives) that align with the organization’s direction. - SHRM Human Strategy: Capability
3rd Premise Companies that leverage human capital well outperform those that do not Table from Boston Consulting Group/WFPMA, From Capability to Profitability: Realizing the Value of People Management (July 2012).
Last one… HR Initiatives compete with other initiatives and priorities in the value chain Porter’s Value Chain Any jerk can have short-term earnings. You squeeze, squeeze, squeeze, and the company sinks five years later. - Jack Welch
THINK The Human Resource department in my organization is focused on (operational effectiveness, strategic positioning, something else)___________________? PAIR SHARE
How can HR ….. • Contribute to Op. Effectivness & Strategic Positioning • Make the importance of human capital visible • Compete internally for time and resources
MEASUREMENT • Develop new insights and understanding of business performance based on DATA and STATISTICAL METHODS.
Measurement (Analytics) help immunize firms against short-termism. Business analytics (BA) - skills, technologies, applications and practices for continuous iterative exploration and investigation of past business performance to gain insight and drive business planning. Business analytics focuses on developing new insights and understanding of business performance based on DATA and STATISTICAL METHODS.
Analytics Competitor: A’S, Red Sox • Moneyball by Michael Lewis • A’s consistently make the playoffs despite a low overall payroll • New metrics for player selection: “on-base percentage” and “on-base plus slugging percentage” • Boston Red Sox • Example: Martinez easier for opposing batters after 7 innings or 105 pitches (ALCS 2003)
Analytics Competitor: Harrah’s Entertainment • Customer loyalty card data used in near-real time to optimize yield, set prices for slots and rooms, and design traffic through the casinos • Predict the “pain point” and pull you away from the slot machine • Which marketing initiatives to move through which channels • HR analytics used in recruiting process
APQC Study: Process Measures and Analytics Analytics Competitor: Industry Five participating companies: Wyeth, ING, Marriott International, General Electric, Caterpillar • Key findings: • Analytics are applied within processes as early warning indicators • Value of analytics greatly enhanced when integrated into day to day processes • Integrating process analytics with continuous improvement techniques such as Six Sigma and Lean drives action and bottom line results
THINK In my organization HR is evaluated based on the following measures/metrics (i.e. turnover, UI Claims, etc.) ____________________ ____________________ ____________________ PAIR SHARE
90% of Fortune 500 organizations evaluate HR operations on basis of three metrics: • Employee retention and turnover • Corporate morale • Employee satisfaction • These metrics do not necessarily illustrate how HR impacts • Profits • Shareholder value
What factors contribute to the turnover of chemists? Predicting What critical experiences are needed to become a Plant Manager? Average YOS for promotion to Director Trending/ Analyzing Time to Hire by function Number of chemistry degrees Reporting Training Participation Headcount Getting Beyond the wall in HR measurement…..
Requires a Shift in Mindset • From “I think…” to “I know…” • From reporting to predicting
Value Added Tasks INPUT OUTPUT Applying PDCA Adopt an analytical view of HR How does your department and your process add value to FM and the customer?
Value Added Tasks How does your department and your process add value to FM and the customer?
Value Added Tasks “Bottom-Line” HR Metrics. WHAT SHOULD I MEASURE? It depends… What is the value added task?
HR Measurement Hidden slides in the packet available to you digitally Top Ten HR metrics list
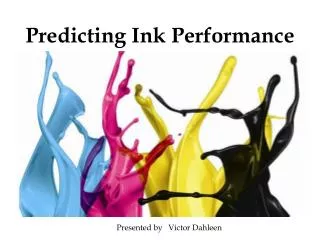
So where do I start…… THE “BASIC SEVEN TOOLS OF QUALITY ” 105,000,000 results on gooogle Cause-and-effect diagram: Identifies many possible causes for an effect or problem and sorts ideas into useful categories. Check sheet: A structured, prepared form for collecting and analyzing data Control charts: Graphs used to study how a process changes over time. Histogram: Graph for showing frequency distributions Pareto chart: Bar graph which factors are more significant. Scatter diagram: Graphs pairs of numerical data, to look for a relationship. Stratification: A technique that separates data gathered from a variety of sources so that patterns can be seen (some lists replace “stratification” with “flowchart” or “run chart”).
FMLA Absence last 120 days Example How would you interpret this data? What can you say about the amount of variation? What about the pattern of variation?
Histogram of FMLA DAYS Frequency Days The histogram gives us a visual summary of the data.
Center of the data Shape of the data Spread of the data Histogram of sales measurements What does the histogram show us?
Sample Follow-up Chart • Issue:While the Time to Fill cycle time (Offer to Accept) was a respectable 40 days, the Time to Start cycle time (Open to Start) was exceeding the external benchmark. In addition, from a customers point of view, the cycle time was unacceptable at 91 days (Create to Start). The following action steps will be taken: • Communicate to managers the need to improve the approval cycle and provide visibility to initiating manager of the status of the requisition • Investigate why the Approval (final management sign-off) to Open (assignment to recruiter) is taking so long • Be more diligent on closing the deal (shorten offer acceptance and accept to start)
A good tool to consider….. QI Macros SPC Software for Excel Free 30-Day Trial for PC & Mac Users • QI Macros Fill-in-the-Blank Templates and Tools for Lean Six Sigma • Drawing flowcharts, value stream maps and Ishikawa diagrams? • Updating monthly charts and dashboards? • Advanced analysis like Gage R&R, DOE, and so on?
Charting • Some rules of thumb for constructing charts and graphs • Hidden Slides in the packet available to you digitally
THINK In my organization HR use the following analytical tools and software to provide a predicative capability ____________________ ____________________ ____________________ PAIR SHARE
Does this sound familiar? Evaluating enterprise products and services
42 Start with the end in mind… Return on Investment • Why would the CxO write the check for technology procurement? • Don’t automatically accept the incumbent system due to investment – those are sunk costs Return on Expectations • What is your strategy? • What are your drivers? • Does the system align with your needs? • At the end of the day, how do stakeholders expect the system to add value and improve their work life?
Items to consider for planning • Staffing • Without an appropriately staffed HRIS group to deploy, own and continuously market the applications, the effort will die on the vine • Hybrid skill set – high tech, high touch • If you depend on an internal IT group, what is their skill set? What type of technologies can they support? • Define your key drivers • Determine organizational direction • Global expansion? • Emphasis on talent management? • Economics • Funding availability • Timing • The world moves quickly; if process and technology rollouts don’t keep up you’ll set yourself up to fail • Short term planning (up to 1 year) should be your target
Caveat Emptor • The 80/20 rule applies • In most cases 80% of the functionality will be common • What’s that 20% difference and does it matter to you? • A long list of features doesn’t matter unless they match your requirements • Use scenario-based requirements for demos • Send to the short-list vendors ahead of time so they can prepare • Allow the requisite exec summary and system overview • Always remember what your drivers are • Make sure all scenarios are addressed • Save the glitz for last and be a healthy skeptic (demos are meant to be smooth) • Reality checks • Search reference lists for comparable situations – software versions, services selection, consultant roles • Bad marriages lead to ugly divorces • Best practices aren’t necessarily the ‘best’ for your company • Beware the stylish haircut – look in the mirror and make an honest self-assessment
How do you find a consultant? • Selection should be as rigorous a process as system selection • Problem solver • Excellent communicator • Personally disciplined • Passion for doing what’s best for the client • Know your ‘needs requirements’ – strategic planning, project management or group therapy? • You must ‘click’ on • Approach • Cost • Personality/Culture • Check references • Use websites and referrals from similar companies/projects
Research & Advisory Independents Implementation Niche Centric Broad HR Boutique ???? Benchmarking The Big Boys – Multiple practices Strategic/ C-Level The Consulting Landscape Gartner AMR Forrester IDC Aberdeen ERP VendorsSAP Oracle IT body shops CSC EDS (HP) CAP Gemini Product boutiques – Oracle: Kbace HR Technology Solutions Beachside Consulting (google on personal names) Executive Alliance HRchitect Jeitosa Group Intl WorkStrategy Wise Consulting Recruitment mgmt – The Newman Group (Futurestep) Talent Management – Knowledge Infusion Bersin & Associates BPO/IT outsourcing – Equaterra TPI Everest Research Inst Accenture Deloitte & Touche PWC Towers Watson IBM Boston Consulting Grp The Hackett Group Bloom & Wallace
49 Objective Vendor/Product Analysis – Decision drivers and Scenario-based demos (not RFPs)
HRMS Enterprise Software Comparisons • Comparehris.com • Capterra.com • http://free-report.technologyevaluation.com • “This knowledge base on human resources management systems affords clients the opportunity to rapidly determine their criteria for management and employee personnel tasks. Its extensive criteria include benefits and payroll management, employee self service, data warehousing, and health and safety requirements.”
Best Practices • Adopt a “business intelligence mindset” • Start small and build credibility • In the early stages, focus on solving immediate problems • Have the end in mind and build an infrastructure to support it • Collaborate with other analytic groups within your company • Build/buy analytics competence with HR • Engage a leader who has an analytics understanding, passion, and interest
Pitfalls to Avoid • Using analytics to “prove HR’s worth” • Assigning this mission to a lower level technician • Don’t confuse: • Data dumps with insight • Benchmarking with analytics • Rushing the process • Allowing the perfect to become the enemy of the good
MEASURING HR PERFORMANCEMoving from reporting to predicting KEVIN HENSON khenson@greatplains.edu 580-250-5585 “We live in a society bloated with data but starved for wisdom.” Elizabeth Lindsey, Ethnographer and National Geographic Fellow