Download

1 / 35
350 likes | 513 Views
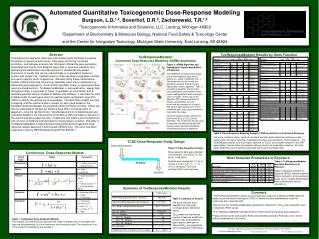
Evaluating and quantifying benefit of exposure-response modeling for dose finding. Jos é Pinheiro and Chyi-Hung Hsu Novartis Pharmaceuticals PAGE Satellite Meeting – Saint Petersburg – June 23, 2009 Collaboration with PhRMA Working Group on Adaptive Dose-Ranging Studies. Outline.

E N D
Evaluating and quantifying benefit of exposure-response modeling for dose finding José Pinheiro and Chyi-Hung Hsu Novartis Pharmaceuticals PAGE Satellite Meeting – Saint Petersburg – June 23, 2009 Collaboration with PhRMA Working Group on Adaptive Dose-Ranging Studies
Outline • Motivation • Background: PhRMA Adaptive Dose-Ranging Studies WG • Dose-exposure-response modeling framework • Estimation of target doses and dose-response profiles under dose- and exposure-response modeling • Simulation study to compare DR- and ER-based estimation • Conclusions Exposure-response in dose finding
Motivation • Poor understanding of (efficacy and safety) dose response: pervasive problem in drug development • Indicated by both FDA and Industry as one of the root causes of late phase attrition and post-approval problems – at the heart of industry’s pipeline problem • Currently “Phase III view” of dose finding: focus on dose selection out of fixed, generally small number of doses, via pairwise hypothesis testing inefficient and inaccurate Exposure-response in dose finding
What is the problem? Response Selected doses Dose • True DR model unknown • Current practice: • Few doses • Pairwise comparisons “dose vs. placebo“ • Sample size based on power to detect DR Large uncertainty about the DR curve and the final dose estimate Exposure-response in dose finding
PhRMA Adaptive Dose-Ranging Studies WG • One of 10 WGs formed by PhRMA to address key drivers of poor performance in pharma industry • Goals: • Investigate and develop designs and methods for efficient learning of efficacy and safety DR profiles benefit/risk profile • Evaluate operational characteristics of different designs and methods (adaptive and fixed) to make recommendations on their use • Increase awareness about adaptive and model-based DF approaches, promoting their use, when advantageous • How: comprehensive simulation study comparing ADRS to other DF methods, quantifying potential gains • Results and key recommendations from first round of evaluations published in Bornkamp et al, 2007 Exposure-response in dose finding
PhRMA ADRS WG: key conclusions • Detecting DR is much easier than estimating it • Sample sizes for DF studies are typically not large enough for accurate dose selection and estimation of dose response profile • Adaptive dose-ranging and model-based methods can lead to substantial gains over traditional pairwise testing approaches (especially for estimating DR and selecting dose) Exposure-response in dose finding
Key recommendations • Adaptive, model-based dose-ranging methods should be routinely considered in Phase II • Sample size calculations for DF studies should take into account precision of estimated dose; when resulting N not feasible, consider ≥ 2doses in Ph. III • PoC and dose selection should, when feasible, be combined in one seamless trial • To be further explored: • Value of exposure-response (ER) modeling • Additional adaptive, model-based methods • Impact of dose selection in Phase III Exposure-response in dose finding
Goals of this presentation • Describe statistical framework for evaluating and quantifying benefit of ER modeling for estimating target dose(s) and dose-response (DR) • Present and discuss results from simulation study investigating: • reduction in response-uncertainty, related to inter-subject variation, by switching the focus from dose-response (DR) to exposure-response (ER, PK-PD) models • impact of intrinsic PK variability and uncertaintyabout PK information on the relative benefits of ER vs. DR modeling for dose finding Preliminary investigations leading to collaborative work with ADRS WG Exposure-response in dose finding
Exposure-Response model • Parallel groups – k doses: d1< …< dk, d1 = placebo • Exposure represented by steady-state area under the concentration curve AUCss,ij = di/CLij • CLij is clearance of patient j in dose group i • Sigmoid-Emax model for median response μijE0 is placebo response, Emax is max effect, EC50 is AUCss giving 50% of Emax, h is Hill coefficient Exposure-response in dose finding
Exposure-Response model (cont.) • Conditional on μij, response yij has log-normal distr.σy ≈ coeff. of variation (CV) – intrinsic PD variability • Clearance assumed log-normally distributedσCL– intrinsic PK variability • In practice, CLij measured with error: observed valueσU – measurement error variability Exposure-response in dose finding
ER models: E0=20, Emax=100, σy=10% Exposure-response in dose finding
PK and measurement variability on CL • Impact of σCL • Impact of σU(σCL =50%) Exposure-response in dose finding
PD and measurement variability on response • σy=10% Exposure-response in dose finding
Dose-Response model • Dose derived from exposure as di = CLij AUCss,ij • Sigmoid-Emax ER model for median response μij can be re-expressed as a mixed-effects DR modelE0, Emax, and h defined as in ER model and ED50,ij = CLij EC50 is the (subject-specific) dose at which 50% of the max effect is attained • From distributional assumptions of ER model Exposure-response in dose finding
Dose-Response model (cont.) • Typical value of ED50: TVED50 = TVCL×EC50 • DR model accommodates intrinsic inter-subject (PK) variation by allowing ED50 to vary with patient • Not estimable (under frequentist approach) unless multiple observations per patient available • In practice, model is fitted assuming ED50 is fixedmedian response depends on dose only, not varying with subject Exposure-response in dose finding
DR models: E0=20, Emax=100, σy=10% Exposure-response in dose finding
Model estimation • Bayesian methods used to estimate both ER and DR models, and target dose (frequentist methods could also be used) • Measurement error incorporated in ER model by assuming observed CL as realizations from (marginal) lognormal distr. with pars. log(TVCL) and - note that σCL and σU are confounded • Model with fixed ED50 used for direct DR estimation • Indirect DR estimation can be obtained from fitted ER model, using TVED50 = TVCL×EC50 to estimate ED50 – remaining parameters are the same • Non-informative priors typically assumed for all model parameters, but informative priors can (and should) be used when information available (e.g., previous studies, drugs in same class, etc) Exposure-response in dose finding
Target dose • Criteria for dose selection typically a combination of statistical significance (e.g., superior to placebo) and clinical relevance (e.g., minimal effect) • Use a Bayesian definition for the minimum effective dose (MED) – smallest dose producing a clinically relevant improvement Δover placebo, with (posterior) probability of at least 100p% • MED depends on median DR profile μ(d) and intrinsic PK variability σCL • Alternative target dose: EDx – dose producing x% of maximum (median) effect with at least 100p% prob. Exposure-response in dose finding
Simulation study • Goal: quantify relative performance of ER vs. DR modeling for dose selection and DR characterization under various scenarios – identify key drivers • 120 scenarios considered – combinations of: • Sig-Emax ER models (4), all with E0=20 and Emax=100: • intrinsic PK variability (3): σCL = 30%, 50%, and 70% • PK measurement error var. (5): σU = 0%, 20%, 40%, 60%, and 80% • PD variability (2): σy = 10% and 20% • Basic design: parallel groups with 5 doses: 0, 25, 50, 75, and 100 mg – 150 patients total (30/dose) • Typical value of clearance: TVCL = 5 Exposure-response in dose finding
Simulation ER models: E0=20, Emax=100, σy=10% Exposure-response in dose finding
Simulation study (cont.) • MED estimation: • clinically relevant difference: Δ = 60 • posterior probability threshold: p = 0.7 • Estimates truncated at 101 mg (if > 100 mg) • True MED values: depend on model and σCL • Non-informative priors for all parameters in Bayesian modeling • 1,000 simulations used for each of 120 scenarios • Bayesian estimation using MCMC algorithm in LinBUGS implementation of OpenBUGS 3.0.2 (linux cluster) Exposure-response in dose finding
MED estimation – Model 1 Exposure-response in dose finding
MED Performance of ER vs. DR – model 1 • Under 0% PK measurement error, ER provides substantial gains over DR - smaller bias (≈ 0 for ER) and variability. • MED estimation performance of ER deteriorates as Uincreases: up to 20%, still superior to DR, but same, or worse for U = 40%; DR better than ER for U > 40%. • Performance of DR worsens with increase in CL - dose decreases its predictive power for the response. • Bias of ER MED estimate decreases with CL from 30% to 50%, but increases (and changes sign) from 50% to 70%. Its variation is not much affected. • ER and DR MED estimates variability ↑ with σY, but not much • Model 2: estimation features magnified: ER performance worsens more dramatically with U, DR deterioration with σCL also more severe. ER only competitive with DR U ≤ 20% Exposure-response in dose finding
MED estimation – Model 2 Exposure-response in dose finding
MED estimation – Model 3 Exposure-response in dose finding
ER vs. DR MED Performance – model 3 • DR underestimates MED; ER overestimates it with increased σU (as in the previous two models). Bias gets worse with increase in σCL. Because of the high bias associated with DR, ER estimation is competitive up to 40% values of σU. • PD variability (Y) has much greater impact in performance than in models 1 and 2 – substantial variability increase, not much change in bias, when Y increases from 10% to 20%. • Overall, not enough precision in MED estimates under either method, even for ER with σU = 0%. • Poor choice of dose/exposure range (not allowing proper estimation of Emax parameter) partly explains bad performance. Exposure-response in dose finding
Evaluating estimation of DR profile • Performance metric: average relative prediction error (ARPE) where denotes the median response for dose di and its estimate • Relative errors calculated at doses used in trial (k = 5) Exposure-response in dose finding
ARPE – Model 1 Exposure-response in dose finding
ARPE – Model 2 Exposure-response in dose finding
ARPE – Model 3 Exposure-response in dose finding
DR profile estimation – highlights • Model 1: DR prediction performance parallels that for MED estimation: • ER performance deteriorates as σUincreases • DR modeling gets worse with increase in σCL • PD variability has a modest impact on the overall performance. • ER better than DR for σU ≤ 60%, and up to 80% when σCL = 70%. • ARPE relatively small: ≤22% for all scenarios considered. • Model 2: ARPE nearly doubles, compared to model 1, with ER performance deteriorating more dramatically with σU. • DR modeling quite competitive with ER modeling for σCL = 30% and moderately competitive for σCL = 50%. Exposure-response in dose finding
DR profile estimation – highlights (cont.) • Model 3: ARPE shows different pattern, being similar for ER and DR and not varying much with σU or σCL • Possibly due to less pronounced DR relationship • PD variability has more impact on performance than other sources of variation • Overall, prediction errors are not too large (≤ 20%) • ARPE plots for Model 4, and corresponding conclusions, are similar to those for Model 2 Exposure-response in dose finding
Conclusions • ER modeling for dose selection and DR estimation can produce substantial gains in performance compared to direct DR modeling • Relative performance of two approaches highly depends on: • intrinsic PK variability • accuracy of the exposure measurements (i.e., the measurement error). • Advantage of ER over DR increases with intrinsic PK variability, if observed exposure is reasonably accurate • As PK measurement error increases, DR becomes preferable to ER, especially for dose selection. • Partly explained by use of Bayesian MED definition: can not separate estimation of σCL from σU combined estimate obtained, overestimating intrinsic PK variability; gets worse as σU increases Exposure-response in dose finding
Conclusions (cont.) • Likewise, if σCL is high, dose is poor predictor of response and ER methods have greater potential to produce gains • Performance driver of ER modeling (σU) can be improved via better technology (e.g., PK models, bioassays), while σCL, which dominates DR performance, is dictated by nature • Choice of dose range also important performance driver for both ER and DR – difficult problem, as optimal range depends on unknown model(s). Adaptive dose-finding designs can provide a better compromise, with caveats • Impact of model uncertainty also to be investigated to extend results presented here. “Right” model (sigmoid-Emax) assumed known in simulations, but would not in practice. Extensions of MCP-Mod DR method proposed by Bretz, Pinheiro, and Branson (2005) to ER modeling could be considered. Exposure-response in dose finding
References • Bornkamp et al., (2007) Innovative Approaches for Designing and Analyzing Adaptive Dose-Ranging Trials (with discussion). Journal of Biopharmaceutical Statistics, 17(6), 965-995 • Bretz F, Pinheiro J, Branson M. (2005). Combining multiple comparisons and modeling techniques in dose-response studies. Biometrics. 61, 738-748. Exposure-response in dose finding