Download
1 / 1
10 likes | 112 Views
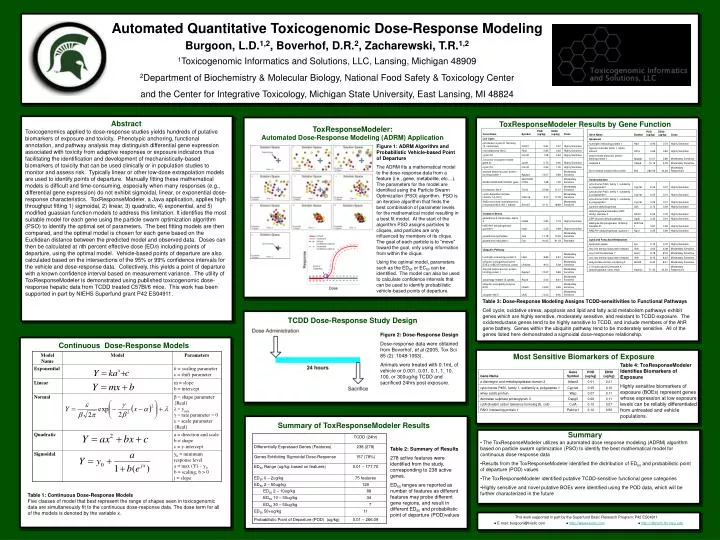
Automated Quantitative Toxicogenomic Dose-Response Modeling Burgoon, L.D. 1,2 , Boverhof, D.R. 2 , Zacharewski, T.R. 1,2 1 Toxicogenomic Informatics and Solutions, LLC, Lansing, Michigan 48909 2 Department of Biochemistry & Molecular Biology, National Food Safety & Toxicology Center

E N D
Automated Quantitative Toxicogenomic Dose-Response Modeling Burgoon, L.D.1,2, Boverhof, D.R.2, Zacharewski, T.R.1,2 1Toxicogenomic Informatics and Solutions, LLC, Lansing, Michigan 48909 2Department of Biochemistry & Molecular Biology, National Food Safety & Toxicology Center and the Center for Integrative Toxicology, Michigan State University, East Lansing, MI 48824 Abstract ToxResponseModeler Results by Gene Function ToxResponseModeler: Automated Dose-Response Modeling (ADRM) Application Toxicogenomics applied to dose-response studies yields hundreds of putative biomarkers of exposure and toxicity. Phenotypic anchoring, functional annotation, and pathway analysis may distinguish differential gene expression associated with toxicity from adaptive responses or exposure indicators thus facilitating the identification and development of mechanistically-based biomarkers of toxicity that can be used clinically or in population studies to monitor and assess risk. Typically linear or other low-dose extrapolation models are used to identify points of departure. Manually fitting these mathematical models is difficult and time-consuming, especially when many responses (e.g., differential gene expression) do not exhibit sigmoidal, linear, or exponential dose-response characteristics. ToxResponseModeler, a Java application, applies high throughput fitting 1) sigmoidal, 2) linear, 3) quadratic, 4) exponential, and 5) modified guassian function models to address this limitation. It identifies the most suitable model for each gene using the particle swarm optimization algorithm (PSO) to identify the optimal set of parameters. The best fitting models are then compared, and the optimal model is chosen for each gene based on the Euclidean distance between the predicted model and observed data. Doses can then be calculated at nth percent effective dose (EDn) including points of departure, using the optimal model. Vehicle-based points of departure are also calculated based on the intersections of the 95% or 99% confidence intervals for the vehicle and dose-response data. Collectively, this yields a point of departure with a known confidence interval based on measurement variance. The utility of ToxResponseModeler is demonstrated using published toxicogenomic dose-response hepatic data from TCDD treated C57Bl/6 mice. This work has been supported in part by NIEHS Superfund grant P42 ES04911. Figure 1: ADRM Algorithm and Probabilistic Vehicle-based Point of Departure The ADRM fits a mathematical model to the dose-response data from a feature (i.e., gene, metabolite, etc…). The parameters for the model are identified using the Particle Swarm Optimization (PSO) algorithm. PSO is an iterative algorithm that finds the best combination of parameter levels for the mathematical model resulting in a best fit model. At the start of the algorithm PSO assigns particles to cliques, and particles are only influenced by members of its clique. The goal of each particle is to “move” toward the goal, only using information from within the clique. Using the optimal model, parameters such as the ED50 or EC50 can be identified. The model can also be used to calculate confidence intervals that can be used to identify probabilistic vehicle-based points of departure. Table 3: Dose-Response Modeling Assigns TCDD-sensitivities to Functional Pathways Cell cycle, oxidative stress, apoptosis and lipid and fatty acid metabolism pathways exhibit genes which are highly sensitive, moderately sensitive, and resistant to TCDD exposure. The oxidoreductase genes tend to be highly sensitive to TCDD, and include members of the AhR gene battery. Genes within the ubiquitin pathway tend to be moderately sensitive. All of the genes listed here demonstrated a sigmoidal dose-response relationship. TCDD Dose-Response Study Design Figure 2: Dose-Response Design Dose-response data were obtained from Boverhof, et al (2005, Tox Sci 85 (2): 1048-1063). Animals were treated with 0.1mL of vehicle or 0.001, 0.01, 0.1, 1, 10, 100, or 300ug/kg TCDD and sacrificed 24hrs post exposure. Continuous Dose-Response Models Most Sensitive Biomarkers of Exposure Table 4: ToxResponseModeler Identifies Biomarkers of Exposure Highly sensitive biomarkers of exposure (BOEs) represent genes whose expression at low exposure levels can be reliably differentiated from untreated and vehicle populations. Summary of ToxResponseModeler Results Summary • The ToxResponseModeler utilizes an automated dose response modeling (ADRM) algorithm based on particle swarm optimization (PSO) to identify the best mathematical model for continuous dose response data • Results from the ToxResponseModeler identified the distribution of ED50 and probabilistic point of departure (POD) values • The ToxResponseModeler identified putative TCDD-sensitive functional gene categories • Highly sensitive and novel putative BOEs were identified using the POD data, which will be further characterized in the future Table 2: Summary of Results 278 active features were identified from the study, corresponding to 238 active genes. ED50 ranges are reported as number of features as different features may probe different gene regions, and result in different ED50 and probabilistic point of departure (POD)values Table 1: Continuous Dose-Response Models Five classes of model that best represent the range of shapes seen in toxicogenomic data are simultaneously fit to the continuous dose-response data. The dose term for all of the models is denoted by the variable x. This work supported in part by the Superfund Basic Research Program: P42 ES04911 ● E-mail: burgoonl@txisllc.com ● http://www.txisllc.com● http://dbzach.fst.msu.edu