Download
1 / 1
20 likes | 187 Views
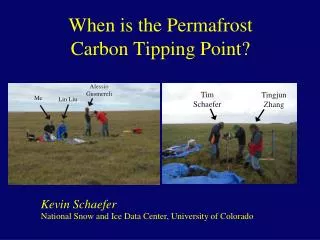
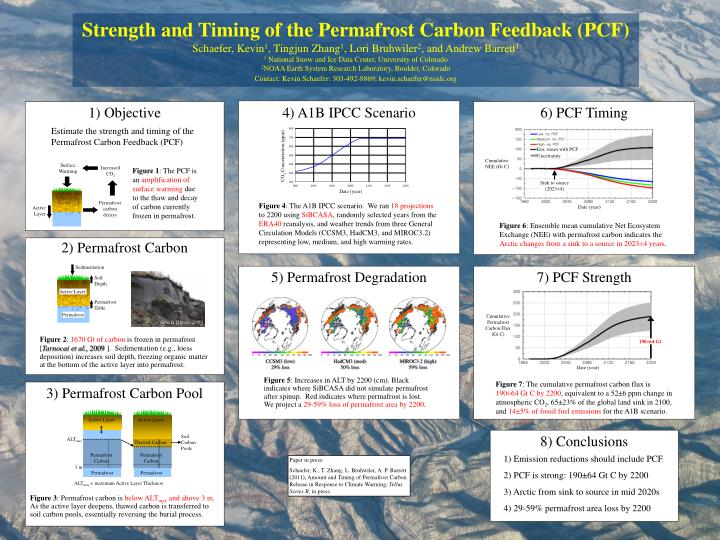
CO 2 Concentration (ppm). Date (year). Strength and Timing of the Permafrost Carbon Feedback (PCF) Schaefer, Kevin 1 , Tingjun Zhang 1 , Lori Bruhwiler 2 , and Andrew Barrett 1 1 National Snow and Ice Data Center, University of Colorado

E N D
CO2 Concentration (ppm) Date (year) Strength and Timing of the Permafrost Carbon Feedback (PCF) Schaefer, Kevin1, Tingjun Zhang1, Lori Bruhwiler2, and Andrew Barrett1 1 National Snow and Ice Data Center, University of Colorado 2NOAA Earth System Research Laboratory, Boulder, Colorado Contact: Kevin Schaefer: 303-492-8869; kevin.schaefer@nsidc.org 1) Objective 4) A1B IPCC Scenario 6) PCF Timing Estimate the strength and timing of the Permafrost Carbon Feedback (PCF) Ens. mean with PCF Uncertainty Cumulative NEE (Gt C) Surface Warming Increased CO2 Figure 1: The PCF is an amplification of surface warming due to the thaw and decay of carbon currently frozen in permafrost. Sink to source (2023±4) Permafrost carbon decays Figure 4: The A1B IPCC scenario. We ran 18projections to 2200using SiBCASA, randomly selected years from the ERA40 reanalysis, and weather trends from three General Circulation Models (CCSM3, HadCM3, and MIROC3.2) representing low, medium, and high warming rates. Date (year) Active Layer Figure 6: Ensemble mean cumulative Net Ecosystem Exchange (NEE) with permafrost carbon indicates the Arctic changes from a sink to a source in 2023±4 years. 2) Permafrost Carbon Sedimentation 5) Permafrost Degradation 7) PCF Strength Soil Depth Active Layer Permafrost Table Permafrost Cumulative Permafrost Carbon Flux (Gt C) Siberia [Davis, 2000] Figure 2: 1670 Gt of carbon is frozen in permafrost [Tarnocai et al., 2009]. Sedimentation (e.g., loess deposition) increases soil depth, freezing organic matter at the bottom of the active layer into permafrost. 190±64 Gt CCSM3 (low) 29% loss HadCM3 (med) 50% loss MIROC3.2 (high) 59% loss Date (year) Figure 5: Increases in ALT by 2200 (cm). Black indicates where SiBCASA did not simulate permafrost after spinup. Red indicates where permafrost is lost. We project a 29-59% loss of permafrost area by 2200. Figure 7: The cumulative permafrost carbon flux is 190±64 Gt C by 2200, equivalent to a 52±6 ppm change in atmospheric CO2, 65±23% of the global land sink in 2100, and 14±5% of fossil fuel emissions for the A1B scenario. 3) Permafrost Carbon Pool Active Layer Active Layer 8) Conclusions Soil Carbon Pools ALTmax Thawed Carbon Permafrost Carbon Permafrost Carbon 1) Emission reductions should include PCF 2) PCF is strong: 190±64 Gt C by 2200 3) Arctic from sink to source in mid 2020s 4) 29-59% permafrost area loss by 2200 Paper in press: Schaefer, K., T. Zhang, L. Bruhwiler, A. P. Barrett (2011), Amount and Timing of Permafrost Carbon Release in Response to Climate Warming, Tellus Series B, in press. 3 m Permafrost Permafrost ALTmax = maximum Active Layer Thickness Figure 3: Permafrost carbon is below ALTmax and above 3 m. As the active layer deepens, thawed carbon is transferred to soil carbon pools, essentially reversing the burial process.