Download
1 / 65
750 likes | 1.18k Views
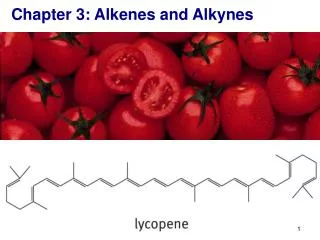
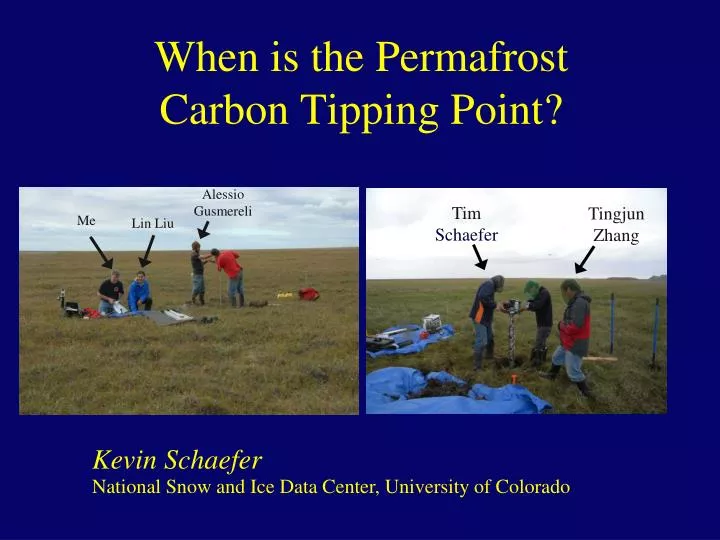
When is the Permafrost Carbon Tipping Point?. Alessio Gusmereli. Tim Schaefer. Tingjun Zhang. Me. Lin Liu. Kevin Schaefer. National Snow and Ice Data Center, University of Colorado. Permafrost Primer. Permafrost: G round at or below 0°C for at least 2 consecutive years

E N D
When is the Permafrost Carbon Tipping Point? AlessioGusmereli Tim Schaefer Tingjun Zhang Me Lin Liu Kevin Schaefer National Snow and Ice Data Center, University of Colorado
Permafrost Primer Permafrost: Ground at or below 0°C for at least 2 consecutive years Active Layer: A layer over permafrost that freezes and thaws annually Permafrost Degradation: A decrease in permafrost extent; an increase in active layer thickness. Skiklomanov [2007]
Permafrost Classification by Area Continuous (>90% of area) Discontinuous (50-90% of area) Sporadic (10-50% of area) Isolated (<10% of area) Brown et al., 1998; Zhang et al., 1999
Permafrost Profile Vegetation Active Layer Permafrost
Permafrost Profile Thermokarst, Alaska Exposed permafrost by river, Siberia [Davis, 2000]
Cryoturbation • Movement of soil or rock due to repeated freezing and thawing Vegetation Active Layer Permafrost PleistoceneCryoturbation, France
Permafrost Features Frost Heave, Yamal Stone Circles, Svalbard Stone Circles, NW Territories Stripes, Glacier NP
Ice Wedges and Polygons 1stWinter 1st Spring 100th Winter 100th Spring Frozen Thawed Frozen Thawed Ice Wedge Crack fills with water & freezes Soil contracts & cracks Active Layer Permafrost Polygons, Yena Polygons, Prudhoe Bay [Zhang, 2009]
Ice Lenses and Layers Year 1,000 Year 1 Active Layer Capillary suction of water to permafrost Active Layer Ice Layer Permafrost Ice Lens Water freezes & expands Permafrost Ice Lenses
Permafrost is Like Concrete Schaefer Wickland
Thermokarst Thermokarst: subsidence or collapse of ground surface due to melting of ground ice Slope Mountain, Alaska [Schaefer, 2012]
Impacts of Degradation Foundation Settling in Chersky Alaska Road Heaves Qinghai-Xizang Highway Bridge Thermokarst in Yakutsk [Skiklomanov, 2005]
Impacts of Degradation Coastal Erosion, Alaska Drying lake, Tibet [Zhang, 2007] Rockfall, Matterhorn [Gruber, 2003] Ice-wedge thaw, Alaska [Davis, 2000]
Global Carbon Cycle Atmosphere 750 Gt + 3 Gt yr-1 120 119 1.9 1.7 90 88 6 Vegetation 600 Gt Soils 1400 Gt Ocean 38,000 Gt Permafrost 1466 Gt Fossil Fuel 4000 Gt
Permafrost Carbon Burial Active Layer Permafrost Deposition (loess, peat, erosion, volcanic) ~1466 Gt C in permafrost [Tarnocai et al., 2009] Soil Depth Permafrost Horizon
Permafrost Carbon 30,000 year old roots, Siberia [Zimov et al., 2006] Mammoth, Siberia 32,000 year old grass, Alaska 15,000 year old moss, North Slope [Schaefer , 2012]
Permafrost Carbon Feedback Amplification of warming due to release of CO2 and CH4 from thawing permafrost
Methane Release from Thawing Permafrost Methane emission emission Methane production Dead plant & animal Thermokarst Erosion remains Peat Thaw bulb Permafrost Burning methane over a thermokarst lake in Siberia (K. Walter) K. Walter ftkmw1@uaf.edu
IPCC A1B Scenario Atmospheric CO2 (ppm) Date (year)
Current Permafrost Active Layer Thickness ALT (cm)
Projected Permafrost Degradation HadCM3 (med) Active Layer Thickness ALT (cm)
Projected Permafrost Loss Increase in ALT by 2200 (cm) CCSM3 (low) 29% loss HadCM3 (med) 50% loss MIROC3.2 (high) 59% loss
Permafrost Carbon Tipping Point Cumulative NEE (Gt C) PCF Tipping Point 2023±4 Date (year) Arctic switches from a sink to a source
Cumulative Permafrost Carbon Flux Permafrost Carbon Flux (Gt C) 190±64 Gt 104±37 Gt Date (year) 65±23% of cumulative global land sink (~160 Gt C) Equivalent to 87±29 ppm
Vostok Ice Core Records CO2 lags behind temperature by 600±400 yr 80 ppm
Paleo-Permafrost Carbon Feedback Orbit perturbations trigger Antarctic permafrost thaw [DeConto et al. 2011, in review] Palaeocene-Eocene Thermal Maximum (PETM)
PCF and Fossil Fuel Emissions • Both inject old carbon into atmosphere • Both irreversible • A1B scenario: 700 ppm by 2100 • 1345 Gt C total emissions • 190 Gt C permafrost carbon flux • 1157 Gt C fossil fuel emissions • Must reduce fossil fuel emissions by additional 15% or overshoot target climate
Conclusions • PCF can explain past climate variability • PCF tipping point in mid 2020s • PCF is strong: 190±64 Gt C by 2200 • Emission reductions must account for PCF • Tellus B paper: Schaefer et al. [2011]
The SiBCASA Model Input Weather Boundary Layer Canopy Latent Heat Sensible Heat NEE GPP CO2 Temp Humidity R Snow Moisture Temperature Carbon Soil
Permafrost Carbon in SiBCASA Active Layer Active Layer Active Layer Thickness (ALT) • 313 Gt C in permafrost carbon pool • 91 Gt C in active layer • 414 Gt C in top 3 m (575 Gt C estimated*) Dmin = max ALT during spinup Soil Carbon Pools Thawed Carbon Permafrost Carbon Pool Permafrost Carbon Pool Dmax = 3 m Permafrost Permafrost *Tarnocai et al. [2009]
Experiment Setup • SiBCASA + ERA40 + A1B scenario • Continuous/discontinuous permafrost • 1973-2001: “spin up“ • 2002-2200: random ERA40 + linear trend • MIROC3.2 (high) • HadCM3 (med) • CCSM3 (low)
Estimating Uncertainty • 18 ensemble members • 3 warming rates • 3 permafrost carbon densities • 2 sub-grid permafrost extents • Best estimate: ensemble mean • Uncertainty: ensemble standard deviation
IPCC A1B Arctic Temperatures CCSM3 (low warming) HadCM3 (medium warming) MIRC3.2 (high warming) Average air temperature for permafrost regions Air Temperature (°C)
Permafrost Area Loss 169±54 Gt C 213±65 Gt C 203±63 Gt C Permafrost Area (%) Date (year)
Frozen Ground Extent Permafrost Seasonally Frozen Ground Intermittently Frozen Ground Snow Limit Zhang et al., 2003. EICOP Permafrost covers 24% of land surface in Northern Hemisphere
What Drives Permafrost Formation? Atmosphere Vegetation Buffer Layer Snow cover Organic layer Permafrost Geothermal
Barrow, Alaska Observed Air Temperature (C) 2003-4 Air Temp (C) Observed Snow Depth (cm) 2002-3 Snow Depth (cm) Observed Soil Temperature (C) 1996-7 Soil Depth (m) Month Soil Temperature (C)
Repeated Soil Freeze/Thaw Cycles Shape Permafrost Landscape • Water expands ~9% when it freezes into ice • Frost Heave: rising of ground surface when ground water Freezes • Thaw Settlement: settling of ground surface when ground ice melts • Moisture Movement: soil moisture moves from unfrozen zone to frozen front
Permafrost Features Frost Heave, Yamal Stone Circles, Svalbard Stone Circles, NW Territories Stripes, Glacier NP
Permafrost Degradation [IPCC, 2007] 4 to 6 C increase in 20th Century 2 to 3 C in last 30 years >3 °C increase mid-1950s to 1990 1 to 3 °C increase in past several decades 0 to 1 °C increase since 1970s
Russian Permafrost Temperature Trends 0.2 m; Trend = +0.78°C/decade 0.4 m; Trend = +0.79°C/decade 0.8 m; Trend = +0.65°C/decade 1.6 m; Trend = +0.55°C/decade 3.2 m; Trend = +0.66°C/decade 4 3 2 1 Temperature Anomaly (°C) 0 -1 -2 Frauenfeld et al. [2004] Zhang et al. [2005] -3 -4 1950 1955 1960 1965 1970 1975 1980 1985 1990 1995 2000 Year
Russian Active Layer Trends 0.3 1960–1998 Change: +25 cm 0.2 0.1 Active Layer Depth Anomaly (m) 0 -0.1 -0.2 Frauenfeld et al. [2004] Zhang et al. [2005] -0.3 1955 1960 1965 1970 1975 1980 1985 1990 1995 2000 Year
Talik Development Talik: Unfrozen soil layer above permafrost, but below seasonally frozen surface layer Soil Temperature at 3.2 m in Central Siberia (°C) 1.0 0.5 0.0 -0.5 Soil Temperature (°C) -1.0 -1.5 Talik Forms -2.0 -2.5 -3.0 1950 1960 1970 1980 1990 2000 Year Seasonally frozen ground Talik Permafrost
Permafrost Carbon • 1672 Gt C in permafrost [Tarnocai et al., 2009] • 750 Gt C in atmosphere Roots, Siberia [Zimov et al., 2006] Mammoth, Siberia Humus, Siberia [Davis, 2000]
Projections of Permafrost Degradation General Pattern: lose area from the south, increase active layer thickness everywhere
Feedbacks to Atmosphere • Energy balance • Snow Albedo Feedback • Vegetation Albedo Feedback • Sea Ice Loss and Arctic Amplification • Bowen ratio seasonality • Trace Gas Feedbacks • CO2 Fertilization • Permafrost Carbon Feedback
Net Ecosystem Exchange (NEE) NEE = Respiration - Photosynthesis • NEE < 0 means net carbon uptake Enhanced by Permafrost Carbon Feedback Enhanced by CO2 Fertilization