Download

1 / 45
450 likes | 527 Views
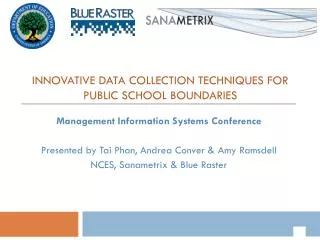
Innovative Use of technology for data collection in youth programs. September 12, 2012. Small group discussion questions.

E N D
Innovative Use of technology for data collection in youth programs September 12, 2012
Small group discussion questions • Scenario 1: You are implementing a youth project in a post-conflict highly volatile area. You need to regularly collect data on your trainees’ performance. The travel is restricted and your beneficiaries are very mobile. How can you use technology to help you? • Scenario 2: Your project is building a system of basic education combined with vocational training for out of school youth in a developing country. You are working closely with the ministry of education and need to have your solution sustainable. How can you use technology to help you? • Scenario 3: You are implementing a youth project in a poorly developed area, and as part of your programming you need to run a quarterly community needs assessment. Your resources are extremely limited, but you need to survey 400 randomly selected people every quarter. How can you use technology to help you?
Mobile Technology in Research and Evaluation Scott Frick, EDC September 12, 2012
Challenge You run a program that provides demand-driven livelihood training to youth ages 15-35. This livelihood program is in a fragile state, and reaches approximately 12,000 youth countrywide through a network of affiliated implementing partner organizations. You have field offices in major towns but the team has few ways of safely traveling to sites outside of these urban areas. You must report on several indicators: • Number of people participating in a given livelihood program • Number of people completing a given livelihood program • Participant placement levels in jobs, internships, self employment and further education after participating in a given livelihood program • Participant satisfaction after participating in a given livelihood program • Participant completion percentages. Would traditional M&E procedures be adequate to gather data on these indicators? How might you use technology to increase accuracy and efficiency?
Solutions Traditional Collection: • Number of people participating in a given livelihood program • Number of people completing a given livelihood program • Participant completion percentages. Tech Assisted Collection: • Participant placement levels in jobs, internships, self employment and further education after participating in a given livelihood program • Participant satisfaction after participating in a given livelihood program
Shaqodoon • What: Provide youth with access to training, internships, work, and self employment. • Why: Productively engage youth & add to the development of the region. • Who: Targets: 8700 Youth Trained, 80% Placed
Shaqodoon How: Worked with employers to identify demand. Assisted education and training providers to develop programs more focused on meeting demand.
Mobile Technology SMS-based Info Match Educational Audio on Demand
Mobile phone use among youth is booming: Mobile phone ownership grew 1600% between 2002 – 2007.
Interactive Audio Instruction Financial Literacy Entrepreneurship
Mobile Infrastructure Used for M&E in 3 Main Ways: • An InfoMatch Survey (SMS) • A placement satisfaction survey (traditional call) • An interactive quiz (touch tone response)
InfoMatch Survey (SMS) • SYLP conducted a one-day cell phone based survey to determine the effectiveness and ease of use of InfoMatch system. (n=200). • Youth were randomly selected from the SYLP monitoring and evaluation database to participate in the survey. • SYLP sent six questions in Somali language via SMS. • A total of US$100 in credit vouchers was split between the first nine respondents as an incentive to complete the survey. • Eighty percent of the youth responded within one hour of the survey being sent. The total response rate was 90 percent.
Placement Satisfaction Survey Using the existing database of learners and cell phones, SYLP conducted phone interviews of learners who had completed the program in Burao.
Findings: Preliminary Mobile Feedback Data Interactive Audio Instruction (IAI) IAI Financial Literacy Series (40 episodes): 757 calls received from 18 devices across Somaliland, Puntaland, South Galkayo for 1400 listeners 50% of groups placed 40+ calls during program period
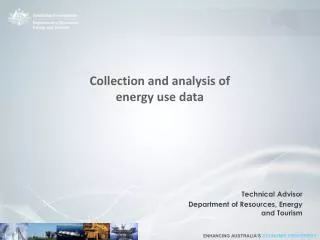
Developing electronic assessment Yvette Tan September 12, 2012
Challenge • Conduct student reading assessment to measure program efficacy • Limited hardware and software options • Needed quick turnaround of results in order to make informed changes/enhancements to program interventions
Pen & paper • Data entry, cleaning and analysis took a long time and involved hiring a number of temporary staff • Took 8 – 10 months to turn around results
Electronic Solution • Developed an electronic version of the assessment using Excel that runs on macros. • Instructions were standardized by adding an audio file to make sure that every student gets the same instructions.
Electronic Solution • Has a built in timer to automatically calculate correct letters and words read. This is important because most data input mistakes are made through human errors on this calculation.
Electronic Solution • Has a built-in database and a corresponding results page for immediate viewing of results.
Advantages • Less costly – did not have to hire encoders • Can run on any netbooks and laptops • Easy to use – administrators were trained in a day on how to use the software • Results were turned around in less than a month – very useful in informing program design/re-design
Additional information Visit http://eegra.edc.org/
Mobile Technology in Research and Evaluation Elena Vinogradova September 12, 2012
Challenge • Quarterly community needs assessment in a remote village in Kenya • Low M&E budget • Team: one manager, 8 data collectors
Pen & paper solution Pen & paper survey administration : • Data collection: 16 person days • Data processing: 10 person days • Data set preparation for analysis: 2 days Total: 28 person days, at least three week lag between data capture and data analysis. In reality – a few months lag
Mobile Solution A solution that we tested: by
Advantages • Inexpensive (¢11 per survey) • Compatible with Windows and Android • Runs on mobile devices + computers • Full encryption of data • Hosted server • Easy to use
So how does it work? Step One: Program survey in workstation application SurveyToGo Studio Step Two: Download SurveyToGo Mobile App and your survey to the mobile device or computer Step Three: Go get your data! Step Four: Your data is ready for analysis!
Back to Kenya: administration using SurveyToGo with Lenovo tablets Total cost savings: up to 75% Increase in data quality: priceless
As the screen print above shows, the software collects information on survey administration that allows us to easily weed out fabricated data
Testimonial from the field: Kenya “You can’t compare using paper administration and using the tablets. The tablets have saved us time with surveys being conducted faster as interviewers do not have to think about the instructions of skipping questions. This has also reduced the errors that we initially had with the paper administrations. For me the best part about the tablets is not having to go through each questionnaire to check for errors at the end of each day of data collection, and not having to spend at least a month on entering data, verification and scanning of the hard copies. ” M&E Manager
Integrating technology in the M&E structure EDC Project in Pakistan: the first project with the fully integrated technology in the M&E system: • In all one-on-one data collection paper is replaced with tablets • All data entry occurs via tablets • Results are immediately available for management decisions.
OR using technology for the single administration Survey administration in Rwanda in February of 2012: • Short timeline • Target: 900 surveys • Challenge: illiterate respondents • Solution: 26 trained interviewers collect data using tablets
Testimonial from the field: Rwanda “The time and money this application saved us is huge. We were able to significantly cut our daily paper usage by a large percentage, (imagine the amount of paper that would have been used for 900 surveys !!!). It was great to conduct surveys without the delays of printing and shipping paper forms. We did not need to worry about paper forms being lost or damaged. With tablets we did not need to re-enter data into a computer because its digital to start with. So there were no delays in that regard.” M&E Manger of AkazeKenozi in Rwanda
Functionality • Question branching, skipping and looping • Photo, Video & Voice Recording that can be attached to individual surveys • Data export to SPSS, MS Excel, MS Access, MS Word, XML • Offline and online data capture • Fast and easy data processing • Sophisticated user support • Multi language support • Data integrity assessment
Conclusions Use of mobile technology with SurveyToGo application allows us • Reduce cost associated with data capture and processing • Increase control over the process of data capture and processing • Eliminate time lag between data capture and data analysis • Improve data quality by reducing human interaction with data • Improve overall quality of evaluations by investing in the development and analysis rather than data collection and processing