Download
1 / 24
250 likes | 367 Views
Sea-level rise: another face of climate change. Prof. David G. Vaughan British Antarctic Survey. Mitigation. > 500 yrs. Response to sea-level rise. Sea-level rise. < 200 yrs. Adaptation. Emissions of greenhouse gases. Photo – flickr / Tc7. Sea-level rise by ocean warming.

E N D
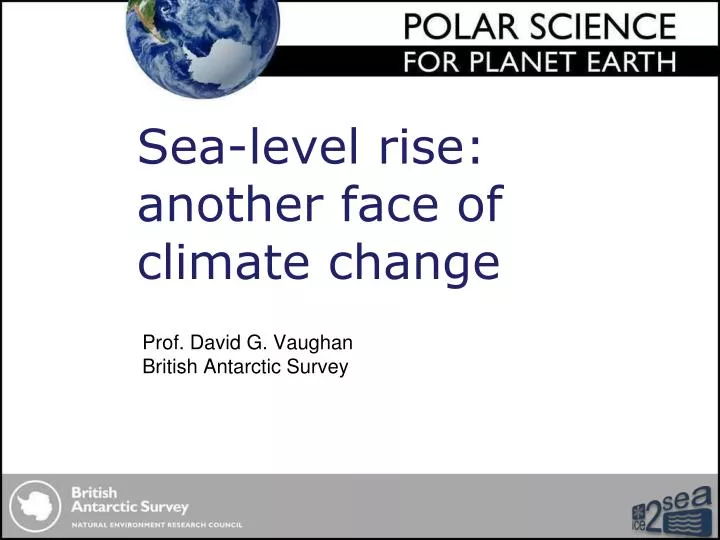
Sea-level rise: another face of climate change Prof. David G. Vaughan British Antarctic Survey
Mitigation > 500 yrs Response to sea-level rise Sea-level rise < 200 yrs Adaptation
Emissions of greenhouse gases Photo – flickr / Tc7
Sea-level rise by loss of mountain glaciers Muir Glacier 1941 - 2004 W. O. Field, B. F. Molnia
Recent sea-level rise 3.2 mm/year 2.0 mm/year 0.8 mm/year
IPCC (2007) on sea-level rise Models used […] do not include the full effects of changes in ice sheet flow, because a basis in published literature is lacking. The projections include a contribution due to increased ice flow from Greenland and Antarctica at the rates observed for 1993-2003, but these flow rates could increase or decrease in the future. For example, if this contribution were to grow linearly with global average temperature change, the upper ranges of sea level rise for SRES scenarios shown in Table SPM-3 would increase by 0.1 m to 0.2 m. Larger values cannot be excluded, but understanding of these effects is too limited to assess their likelihood or provide a best estimate or an upper bound for sea level rise. {10.6}
Ice-sheet thickness change 2002-06 Pritchard et al., Nature, 2009
Ice-shelf retreat around the Antarctic Peninsula Photo – Vaughan, Jan 2009
Possible future sea-level rise Acceleration to 2.5% per year increase in rate, until 2100 gives 1.4 m cm But rise in last decade is 3.5 cm per year (10 times current), cf MWP1a Continuation of a 1% per year increase in rate, until 2100 gives 53 cm
Interim Defences during Thames Barrier construction 1928 Flood + 1930 Flood Act Late C19 update to Flood Act 1879 Flood Act Flood defences in London
Flood return at Thames Barrier 1 10 100 1000 1 10 100 1000 Source: Dawson et al. (2005), Jones (2001), Environment Agency (2003a)
Coastal populations Elevation (m) 300 200 Population (Millions) 100 0 20 40 60 80 100
Developing countries Photo – Flickr / Dan..
Science and prediction The 100th Thames Barrier Closure Photo – flickr / jkpaul
Cascade of uncertainty in sea-level rise projection Compounding of error
A role for science in 2010? • Improved quantification of risk • Improved basis for sea-defence planning • Support for coastal adaptation and management • (Avoidance of unwarranted expenditure) • Fuller evaluation of long-term impact of climate change
Coordinator: David G. Vaughan Information: www.ice2sea.eu