Download
1 / 16
160 likes | 315 Views
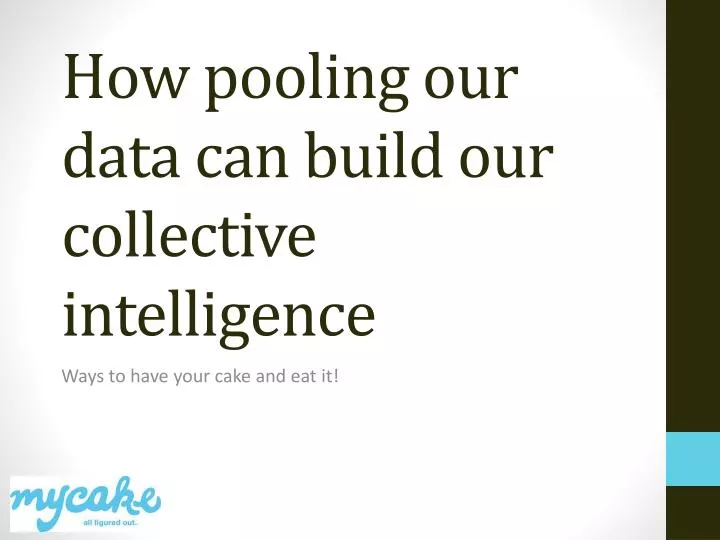
How pooling our data can build our collective intelligence. Ways to have your cake and eat it!. Overview. What is comparative & collective data and what is it good for? Common Data Traps What benefits are accruing to those who DO benchmark? What other sources of data can I make use of?

E N D
How pooling our data can build our collective intelligence Ways to have your cake and eat it!
Overview • What is comparative & collective data and what is it good for? • Common Data Traps • What benefits are accruing to those who DO benchmark? • What other sources of data can I make use of? • A few tips for making best use of these data sources • A look at some data • An overview of who else is interested in benchmarking in the third sector
What is comparative data • Your data compared confidentially and anonymously vs. your peers • Financial data (profit & loss, balance sheet), social impact data etc • It’s nothing new - Keynote, Mintel and other published reports • Online benchmarking .. is newer but we’ve been doing it since late ’90’s so not that new!
What is comparative & collective data good for? Internal goal setting: • Seeing where you are strong (vs. your peers) • Seeing what needs improvement • Diversifying income and/or managing cost • Setting targets that are more than ‘plus a bit/minus a bit’ To stakeholders, funders etc: • Stronger funding applications • Galvanizing Volunteers & Members • Communicating your achievements
What is comparative & collective data good for? With trade bodies and professional organisations: • Identifying areas where support or development is required • Monitoring trends and the impact of sector development activities For the non-profit culture sector as a whole: • Communication of the overall contribution to GDP (or it would be if we had a total for the turnover of the sector) • Lobbying to the Treasury by DCMS and others
Common Data Traps • Lack of data on peers • Lack of data that is sliced by region, sector, size, role in ecosystem • Focus only on the best practice of the large organisations and expecting this to be relevant to small & non-venue based organisations • Filling in surveys but not holding the survey owners accountable for the usefulness of results reporting • Too long a delay between survey completion and results publication/access • Using above as excuses to not bother comparing progress and over reliance on qualitative arguments
What benefits are accruing to those who DO benchmark? • Pragmatic and realistic goal setting for new areas of income development e.g. donations & sponsorship • Greater clarity on how a business model may change as an organisation grows e.g. changes from <£200k to £750k to £2m • More detailed understanding of how the ‘best in class’ achieve their successes • Succinct summary of greatest weaknesses and risks • Development of key comparison points for their organisation so that staff and board can track these regularly • Greater visibility with and respect from funders • Seen as leaders who are using all the resources available to them to continue to develop their organisation in a tough climate e.g. Common Practice
A few tips for making best use of these sources: • Think of the key types of comparison that would be most useful to you e.g. by turnover, venue/non-venue, art form, location etc • Decide whether any of these are mutually exclusive (if so you’ll need more than one comparison group) • Come up with a list of the best sources for information on these topics or companies • Come up with a list of key organisations to compare yourself to • Pull together the data on these topics and organisations into a single spreadsheet …. If you don’t then the different definitions and layout of the information will hinder analysis • Report on the findings to your staff and Board at least once a year, quarterly if the data changes more frequently or is a live issue.
West Midlands vs. M’chester, N’castle & London (2010 data, in the arts)
Who else is interested in benchmarking in the third sector? • NCVO, Charity Finance Group • Big Society Capital, Big Issue Invest and other social investors • Paul Hamlyn Foundation and other trusts & foundations • Core Cities group & assorted Local Authorities • Various Arts Councils and Creative Scotland