Download
1 / 18

E N D
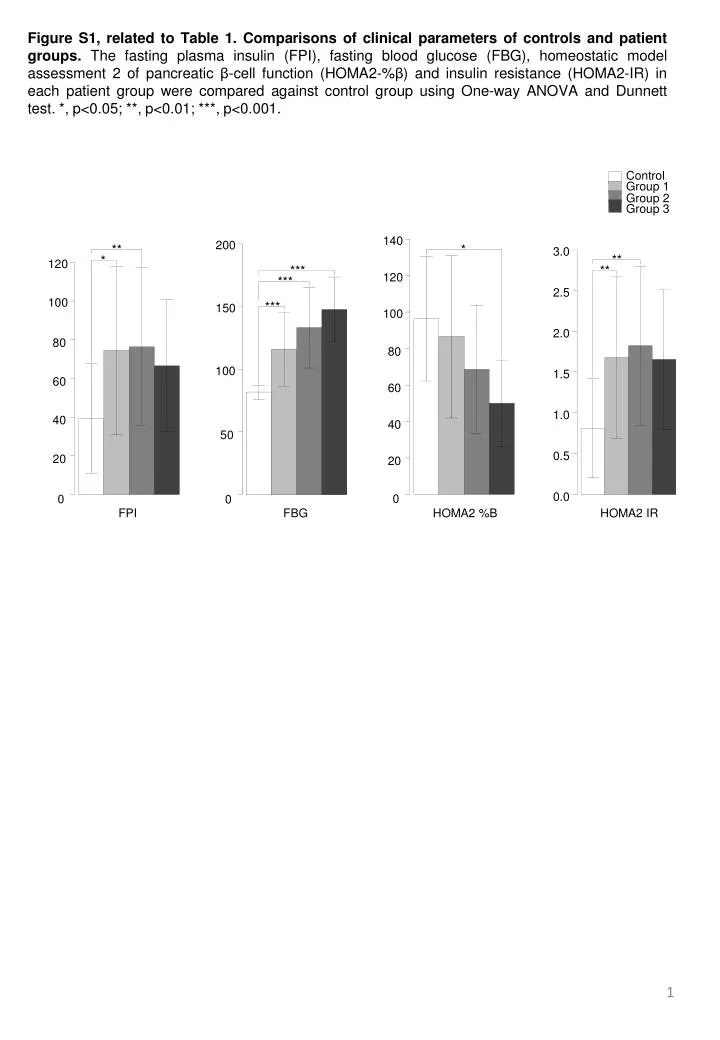
Figure S1, related to Table 1. Comparisons of clinical parameters of controls and patient groups. The fasting plasma insulin (FPI), fasting blood glucose (FBG), homeostatic model assessment 2 of pancreatic β-cell function (HOMA2-%β) and insulin resistance (HOMA2-IR) in each patient group were compared against control group using One-way ANOVA and Dunnett test. *, p<0.05; **, p<0.01; ***, p<0.001. Control Group1 Group2 Group3 140 200 ** * 3.0 ** * 120 *** ** 120 *** 2.5 100 *** 150 100 2.0 80 80 100 1.5 60 60 1.0 40 40 50 0.5 20 20 0.0 0 0 0 FPI FBG HOMA2 %B HOMA2 IR
Figure S2. Variations in the total level of polar lipids among individual subjects. Total polar lipids were calculated by sum all phospholipid and sphingolipid species measured in the current study. Values were presented as amounts of polar lipids (μg) per unit volume of plasma (mL). Control Group 1 Group 2 Group 3
Figure S3, related to Figure 1. Changes in plasma lipid classes amongst subject groups. (A) Relative abundance of total PC, SM, PE, PI, LPC, LPE, PS; (B) Relative abundance of total Glucer, GM3, Cer; LacCer; (C) Relative abundance of total PG, LBPA and LPI; (D) Relative abundance of neutral lipids. Levels were normalized to total polar lipids (PL+SPL). *, p<0.05; **, p<0.01; ***, p<0.001. * Control Group 1 A B D *** Group 2 *** Group 3 0.5 0.4 ** *** Mol Fraction 0.3 0.2 *** * ** 0.1 ** * 0.0 Total PI Total LysoPC Total LPE Total PC Total PE Total PS Total SM C ** *** *** *** 6e-04 Mol Fraction 0.015 5e-04 4e-04 0.010 3e-04 2e-04 *** 0.005 * *** *** *** 1e-04 *** *** 3.5 0.000 0e+00 Total LBPA Total PG Total LPI Total GluCer Total LacCer Total GM3 Total Cer 3.0 2.5 2.0 Mol Fraction 1.5 ** * 1.0 0.5 0.0 Total CE Total DAG Cho Total TAG
Fig. S4, related to Figure 1. Human plasma polar lipidome in association with T2DM. (A) Heat plot of individual plasma polar lipid species in four groups of subjects. Values were plotted as log10 of relative abundances of individual lipids, which were normalized to total polar lipids (PL+SPL). (B) Heat plot illustrating plasma lipid aberrations in T2DM. Values were plotted as -log10 of p-values from Dunnett test between individual patient groups and control. P-values>0.05 were plotted as zero (i.e. black) to denote statistical insignificance. The levels of individual sphingolipid species, especially Cer and GM3 species, were significantly (p<0.05) altered in Group 1 and Group 2 patients. A B Cer d18:1/16:0 Cer d18:1/16:0 Cer d18:1/18:0 Cer d18:1/18:0 Cer d18:0/18:0 Cer d18:0/18:0 -1 Cer d18:1/20:0 Cer d18:1/20:0 Cer d18:1/22:0 Cer d18:1/22:0 Cer d18:1/24:1 Cer d18:1/24:1 Cer d18:1/24:0 Cer d18:1/24:0 Cer d18:0/24:0 Cer d18:0/24:0 GM3 18:1/16:0 GM3 18:1/16:0 GM3 18:0/16:1 GM3 18:0/16:1 GM3 18:1/18:1 GM3 18:1/18:1 GM3 18:1/18:0 GM3 18:1/18:0 GM3 18:0/18:0 GM3 18:0/18:0 GM3 18:1/20:1 GM3 18:1/20:1 10 GM3 18:1/20:0 GM3 18:1/20:0 GM3 18:0/20:0 GM3 18:0/20:0 GM3 18:1/22:1 GM3 18:1/22:1 GM3 18:1/22:0 GM3 18:1/22:0 GM3 18:0/22:0 GM3 18:0/22:0 GM3 18:1/24:1 GM3 18:1/24:1 GM3 18:1/24:0 GM3 18:1/24:0 GM3 18:0/24:0 GM3 18:0/24:0 Glucosyl Cer d18:1/16:0 Glucosyl Cer d18:1/16:0 Glucosyl Cer d18:1/18:0 Glucosyl Cer d18:1/18:0 Glucosyl Cer d18:1/20:0 Glucosyl Cer d18:1/20:0 Glucosyl Cer d18:1/22:0 Glucosyl Cer d18:1/22:0 Glucosyl Cer d18:1/24:1 Glucosyl Cer d18:1/24:1 GlucosylCer d18:1/24:0 GlucosylCer d18:1/24:0 LactoCer d18:1/16:0 LactoCer d18:1/16:0 LactoCer d18:0/16:0 LactoCer d18:0/16:0 LactoCer d18:1/18:0 LactoCer d18:1/18:0 LactoCer d18:0/18:0 LactoCer d18:0/18:0 LactoCer d18:1/20:0 LactoCer d18:1/20:0 LactoCer d18:0/20:0 LactoCer d18:0/20:0 LactoCer d18:1/22:0 LactoCer d18:1/22:0 -2 LactoCer d18:0/22:0 LactoCer d18:0/22:0 LactoCer d18:1/24:1 LactoCer d18:1/24:1 LactoCer d18:1/24:0 LactoCer d18:1/24:0 SM18:1/16:0 SM18:1/16:0 SM18:1/18:1 SM18:1/18:1 SM18:1/18:0 SM18:1/18:0 SM18:1/20:1 SM18:1/20:1 SM18:1/20:0 SM18:1/20:0 SM18:1/22:1 SM18:1/22:1 SM18:1/22:0 SM18:1/22:0 SM18:1/24:1 SM18:1/24:1 SM18:1/24:0 SM18:1/24:0 PC32:1e PC32:1e PC32:0e PC32:0e PC34:3e PC34:3e 8 PC34:2e PC34:2e PC34:1e PC34:1e PC36:5e PC36:5e PC36:4e PC36:4e PC36:3e PC36:3e PC36:2e PC36:2e PC36:1e PC36:1e PC38:5e PC38:5e PC38:4e PC38:4e PC38:3e PC38:3e PC40:5e PC40:5e PC40:4e PC40:4e PC40:3e PC40:3e PC40:2e PC40:2e PC32:2 PC32:2 PC32:1 PC32:1 PC32:0 PC32:0 -3 PC34:3 PC34:3 PC34:2 PC34:2 PC34:1 PC34:1 PC36:5 PC36:5 PC36:4 PC36:4 PC36:3 PC36:3 PC36:2 PC36:2 PC36:1 PC36:1 PC38:6 PC38:6 PC38:5 PC38:5 PC38:4 PC38:4 PC38:3 PC38:3 PC40:7 PC40:7 PC40:6 PC40:6 PC40:5 PC40:5 LPC 12:0 LPC 12:0 LPC 14:0 LPC 14:0 LPC16:0e LPC16:0e -log10 (p value) LPC 16:1 LPC 16:1 6 LPC 16:0 LPC 16:0 log10 (mol fraction of total polar lipids) LPC18:0e LPC18:0e LPC 18:2 LPC 18:2 LPC 18:1 LPC 18:1 LPC 18:0 LPC 18:0 LPC 20:0 LPC 20:0 PE34p:2 PE34p:2 PE34p:1 PE34p:1 PE36p:4 PE36p:4 PE36p:3 PE36p:3 PE36p:2 PE36p:2 PE36p:1 PE36p:1 PE38p:6 PE38p:6 -4 PE38p:5 PE38p:5 PE38p:4 PE38p:4 PE38p:1 PE38p:1 PE40p:6 PE40p:6 PE40p:5 PE40p:5 PE40p:4 PE40p:4 PE42p:3 PE42p:3 PE42p:2 PE42p:2 PE42p:1 PE42p:1 PE42p:0 PE42p:0 PE32:2 PE32:2 PE32:1 PE32:1 PE32:0 PE32:0 PE34:2 PE34:2 PE34:1 PE34:1 PE34:0 PE34:0 PE36:4 PE36:4 PE36:3 PE36:3 PE36:2 PE36:2 PE36:1 PE36:1 PE38:7 PE38:7 PE38:6 PE38:6 PE38:5 PE38:5 4 PE38:4 PE38:4 PE38:3 PE38:3 PE38:2 PE38:2 PE40:6 PE40:6 PE40:5 PE40:5 PE40:4 PE40:4 LPE16:0p LPE16:0p LPE16:1 LPE16:1 LPE16:0 LPE16:0 -5 LPE18:1p LPE18:1p LPE18:0p LPE18:0p LPE18:2 LPE18:2 LPE18:1 LPE18:1 LPE18:0 LPE18:0 LPE20:0p LPE20:0p LPE20:1 LPE20:1 LPE20:0 LPE20:0 PI 32:1 PI 32:1 PI 34:2 PI 34:2 PI 34:1 PI 34:1 PI 36:4 PI 36:4 PI 36:3 PI 36:3 PI 36:2 PI 36:2 PI 36:1 PI 36:1 PI 36:0 PI 36:0 PI 38:5 PI 38:5 PI 38:4 PI 38:4 PI 38:3 PI 38:3 PI 38:2 PI 38:2 PI 38:1 PI 38:1 PI 40:6 PI 40:6 PI 40:5 PI 40:5 PI 40:4 PI 40:4 PI 40:3 PI 40:3 PI 40:2 PI 40:2 LPI16:1 LPI16:1 2 LPI16:0 LPI16:0 LPI18:1 LPI18:1 LPI18:0 LPI18:0 PS 34:2 PS 34:2 PS 34:1 PS 34:1 -6 PS 34:0 PS 34:0 PS 36:2 PS 36:2 PS 36:1 PS 36:1 PS 36:0 PS 36:0 PS 38:5 PS 38:5 PS 38:4 PS 38:4 PS 38:3 PS 38:3 PS 38:2 PS 38:2 PS 38:1 PS 38:1 PS 38:0 PS 38:0 PS 40:6 PS 40:6 PS 40:5 PS 40:5 PS 40:4 PS 40:4 PS 40:3 PS 40:3 PG34:2 PG34:2 PG34:1 PG34:1 PG34:0 PG34:0 PG36:4 PG36:4 PG36:3 PG36:3 PG36:2 PG36:2 PG36:1 PG36:1 PG38:2 PG38:2 PG38:1 PG38:1 LBPA34:2 LBPA34:2 LBPA34:1 LBPA34:1 LBPA34:0 LBPA34:0 LBPA36:4 LBPA36:4 LBPA36:3 LBPA36:3 LBPA36:2 LBPA36:2 LBPA36:1 LBPA36:1 LBPA38:2 LBPA38:2 0 LBPA38:1 LBPA38:1 Group 1 vs Control Group 2 vs Control Group 3 vs Control Control Group 1 Group 2 Group 3
Figure S5, related to Figure 1. Distribution of plasma neutral lipid classes among four groups of subjects. Relative abundance of (A) total CE; (B) total TAG; and (C) total DAG in the plasma of control subjects and patients. Levels were normalized to total polar lipids (PL+SPL). Levels of individual classes of neutral lipids in each patient group were compared against control group using One-way ANOVA and Dunnett test. *, p<0.05; **, p<0.01; ***, p<0.001. A CE ANOVA: 1.4e-08 Dunnet: 8.0e-08 , 9.4e-05 , 8.9e-01 4.0 3.5 Mol Fraction 3.0 2.5 2.0 Control Group 1 Group 2 Group 3 B TAG ANOVA: 1.0e-01 Dunnet: 1.2e-01 , 2.5e-01 , 9.7e-01 5 4 3 Mol Fraction 2 1 Control Group 1 Group 2 Group 3 C DAG ANOVA: 4.4e-01 Dunnet: 3.5e-01 , 4.2e-01 , 9.9e-01 0.10 0.08 Mol Fraction 0.06 0.04 0.02 Control Group 1 Group 2 Group 3
Figure S6, related to Figure 1. Alterations in the levels of PC species in diabetic patients. The levels of several predominant diacyl- and ether-PC species (C34-C36) were significantly decreased (p<0.05) in both Group 1 and Group 2 patients, accompanied by concomitant increases in the levels of numerous LPC species. Insulin treatment in Group 3 patients brought about a reversal in the observed trend. *, p<0.05; **, p<0.01; ***, p<0.001. Control Group 1 Group 2 Group 3 A B C ** * 0.012 Mol Fraction 0.010 0.008 *** *** *** 0.006 * * ** * ** *** 0.004 ** * * 0.002 0.000 PC32:1e PC32:0e PC34:3e PC34:2e PC34:1e PC36:5e PC36:4e PC36:3e PC36:2e PC36:1e PC38:5e PC38:4e PC38:3e PC40:5e PC40:4e PC40:3e PC40:2e Mol Fraction *** *** *** 0.12 0.10 * * 0.08 *** 0.06 *** * * 0.04 *** ** ** ** ** ** 0.02 * * * 0.00 ** *** *** 0.0215 *** PC32:0 PC34:3 PC34:2 PC34:1 PC36:5 PC36:4 PC36:3 PC36:2 PC36:1 PC38:6 PC38:5 PC38:4 PC38:3 PC40:7 PC40:6 PC40:5 PC32:2 PC32:1 ** ** 0.0115 * Mol Fraction * 0.0015 *** * * *** * *** 1.5e-06 * * ** 1.2e-06 8.0e-07 4.0e-07 0 LPC 18:1 LPC 18:2 LPC 18:0 LPC 20:0 LPC 16:1 LPC 16:0 LPC 12:0 LPC 14:0 LPC18:0e LPC16:0e
Figure S7, related to Table 2. Scatter plots illustrating the correlation of respective classes of sphingolipids and neutral lipids with FPI, FBG, HOMA-%β and HOMA-IR. Total GluCer Total GM3 TotalCer TotalSM Cholesterol Total CE Total TAG Total DAG 50 100 150 80 100 120 140 160 180 200 50 100 150 0.5 1.0 1.5 2.0 2.5 3.0 3.5 FPI FBG HOMA2 %B HOMA2 IR
Figure S8, related to Table 2. Scatter plots illustrating the correlation of respective classes of phospholipids with FPI, FBG, HOMA-%β and HOMA-IR. Total PC Total PE Total PI Total PS Total LysoPC Total PG Total LBPA Total LPE Total LPI 50 100 150 80 100 120 140 160 180 200 50 100 150 0.5 1.0 1.5 2.0 2.5 3.0 3.5 FPI FBG HOMA2 %B HOMA2 IR
Figure S9, related to Figure 1. Changes in the levels of individual (A) plasmalogen phosphatidylethanolamine (pPE); (B) diacyl PE; and (C) Lyso-PE (LPE) species in healthy controls and diabetic patients. *, p<0.05; **, p<0.01; ***, p<0.001.The reduction in PC and elevated levels of PE in Group 1 and Group 2 patients resulted in a drop in PC:PE ratio in T2DM, which was reversed in insulin-treated Group 3 patients. The reduced PC:PE ratio might have significant impact on the process of lipogenesis through alteration of sterol-regulatory element-binding protein 1 (SREBP-1)-dependent transcription and lipid droplet formation[1]. Thus, the reduced PC:PE ratio might partly account for the enhanced lipogenesis observed T2DM. The ectopic, intracellular accumulation of lipids would further exacerbate the conditions of lipotoxicity and IR in T2DM. Accordingly, the elevated PC levels in insulin-treated patients could serve to restore PC:PE ratio to a normal level, reducing lipogenesis and ectopic lipid accumulation, therefore alleviating the abnormalities of T2DM. Control ** Group 1 Group 2 * Group 3 ** 0.015 ** * 0.010 A B C * 0.005 * * * *** * * ** *** ** * Mol Fraction 0.000 PE34p:2 PE34p:1 PE36p:4 PE36p:3 PE36p:2 PE36p:1 PE38p:6 PE38p:5 PE38p:4 PE38p:1 PE40p:6 PE40p:5 PE40p:4 PE42p:3 PE42p:2 PE42p:1 PE42p:0 0.010 0.008 * 0.006 * Mol Fraction 0.004 * * 0.002 *** * * ** ** 0.000 PE32:2 PE32:1 PE32:0 PE34:2 PE34:1 PE34:0 PE36:4 PE36:3 PE36:2 PE36:1 PE38:7 PE38:6 PE38:5 PE38:4 PE38:3 PE38:2 PE40:6 PE40:5 PE40:4 0.015 Mol Fraction 0.010 * 0.005 ** *** *** *** *** *** 0.000 LPE16:1 LPE16:0 LPE18:2 LPE18:1 LPE18:0 LPE20:1 LPE20:0 LPE16:0p LPE18:1p LPE18:0p LPE20:0p
Figure S10, related to Figure 2. Changes in the levels of individual (A) phosphatidylinositols (PI); (B) phosphatidylglycerols (PG); and (C) phosphatidylserines (PS) species in healthy controls and diabetic patients. *, p<0.05; **, p<0.01; ***, p<0.001.Individual PG species, with the exception of a few polyunsaturated PG species, were increased in Group 1 and Group 2 patients.PG serves as important precursors for cardiolipin (CL) de novo biosynthesis in the mitochondrial membrane[2]. The elevated levels of PG in Group 1 and Group 2 patients might indicate a disruption of CL de novo synthesis, leading to reduced mitochondrial -oxidation that would further aggravate the conditions of lipotoxicity and ectopic lipid accumulation in T2DM. 0.020 Control Group 1 Group 2 Group 3 0.015 A B C 0.010 *** ** ** 0.005 * * * 0.000 Mol Fraction PI 32:1 PI 34:2 PI 34:1 PI 36:4 PI 36:3 PI 36:2 PI 36:1 PI 36:0 PI 38:5 PI 38:4 PI 38:3 PI 38:2 PI 38:1 PI 40:6 PI 40:5 PI 40:4 PI 40:3 PI 40:2 7e-05 6e-05 5e-05 4e-05 3e-05 Mol Fraction ** 2e-05 ** ** * * * 1e-05 * 0e+00 PG34:2 PG34:1 PG34:0 PG36:4 PG36:3 PG36:2 PG36:1 PG38:2 PG38:1 0.0015 *** Mol Fraction ** 0.0010 *** 0.0005 * *** * ** *** *** * *** * *** *** *** *** *** * 0.0000 PS 34:2 PS 34:1 PS 34:0 PS 36:2 PS 36:1 PS 36:0 PS 38:5 PS 38:4 PS 38:3 PS 38:2 PS 38:1 PS 38:0 PS 40:6 PS 40:5 PS 40:4 PS 40:3
Table S1, related to Table 2. Correlation of individual lipid species with FPI, FBG, HOMA2-%β and HOMA2-IR.
Table S1, continued. Correlation of individual lipid species with FPI, FBG, HOMA2-%β and HOMA2-IR.
Table S1, continued. Correlation of individual lipid species with FPI, FBG, HOMA2-%β and HOMA2-IR.
Table S1, continued. Correlation of individual lipid species with FPI, FBG, HOMA2-%β and HOMA2-IR.
Table S1, continued. Correlation of individual lipid species with FPI, FBG, HOMA2-%β and HOMA2-IR.
Table S1, continued. Correlation of individual lipid species with FPI, FBG, HOMA2-%β and HOMA2-IR.
Table S1, continued. Correlation of individual lipid species with FPI, FBG, HOMA2-%β and HOMA2-IR.
Related References 1. Kiebish MA, Bell R, Yang K, Phan T, Zhao Z, et al. .Dynamic simulation of cardiolipinremodeling: greasing the wheels for an interpretative approach to lipidomics. The Journal of Lipid Research .2010;51: 2153-2170. 2. Walker AK, Jacobs RL, Watts JL, Rottiers V, Jiang K, et al. .A Conserved SREBP-1/Phosphatidylcholine Feedback Circuit Regulates Lipogenesis in Metazoans. Cell .2011;147: 840-852.