Download
1 / 6
80 likes | 332 Views
S&P 500 Real Return Histograms. The histogram illustrations on the following pages represent frequency distributions for S&P 500 index total real returns based on a variety of time periods: 1-year holding period 5-year holding period* 10-year holding period* 20-year holding period*

E N D
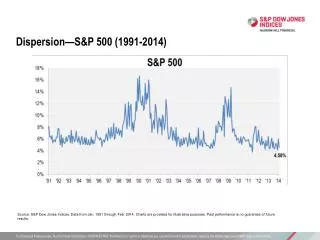
S&P 500 Real Return Histograms The histogram illustrations on the following pages represent frequency distributions for S&P 500 index total real returns based on a variety of time periods: • 1-year holding period • 5-year holding period* • 10-year holding period* • 20-year holding period* (*real returns calculated on a rolling annualized basis) “Real” returns are defined as the annual index return less each year’s respective annual change in the Consumer Price Index for Urban Consumers (CPI-U). This creates an inflation-adjusted real return history. For each chart and each return range, the index real return history is sorted from highest to lowest. For example, in the 1-year holding period chart, the years 1940, 2000, 1966, 2001, 1957, 1981, 1977 and 1969 fall into the return interval of -15% to -10%, with 1940 delivering the highest real return and 1969 having the lowest real return.
Disclosures Performance represents the total return of the Standard & Poor's 500 Index over a variety of time periods. The Standard & Poor’s 500 is an unmanaged, market capitalization-weighted index of 500 widely held stocks of large-cap U.S. companies and is commonly used as a gauge of the overall U.S. equity market. Index returns include dividend and/or interest income and do not reflect the removal of fees or expenses. Index performance is provided as a benchmark but is not illustrative of any particular investment. An investment cannot be made in an index and market indexes do not include expenses. The performance data shown represents past performance, which is not a guarantee of future results. Investment returns and principal value will fluctuate, so that investors' shares, when sold, may be worth more or less than their original cost. The Consumer Price Indexes (CPI) measure changes in the prices paid by urban consumers for a representative basket of goods and services. Sources: Ibbotson, Bureau of Labor Statistics, FPS calculations