Download
1 / 68
720 likes | 1.03k Views
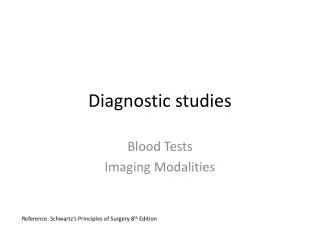
Appraising diagnostic studies. Matthew J. Thompson GP & Senior Clinical Scientist. Overview of talk. Diagnostic reasoning Appraising diagnostic studies. Increase certainty about presence/absence of disease Disease severity Monitor clinical course

E N D
Appraising diagnostic studies Matthew J. Thompson GP & Senior Clinical Scientist
Overview of talk • Diagnostic reasoning • Appraising diagnostic studies
Increase certainty about presence/absence of disease Disease severity Monitor clinical course Assess prognosis – risk/stage within diagnosis Plan treatment e.g., location Stalling for time! Knottnerus, BMJ 2002 What is diagnosis?
Diagnostic errors • Most diagnostic errors due to cognitive errors: • Conditions of uncertainty • Thinking is pressured • Shortcuts are used (Ann Croskerry. Ann Emerg Med 2003) • Human toll of diagnostic errors (Diagnostic errors - The next frontier for Patient Safety. Newman-Toker, JAMA 2009) • 40,000-80,000 US hospital deaths from misdiagnosis per year • Adverse events, negligence cases, serious disability more likely to be related to misdiagnosis than drug errors
Diagnostic reasoning • Diagnostic strategies particularly important where patients present with variety of conditions and possible diagnoses.
Diagnostic reasoning • For example, what causes cough? • Comprehensive history examination differential diagnosis final diagnosis
Diagnostic reasoning • For example, what causes cough? • Comprehensive history…examination…differential diagnosis…final diagnosis • Cardiac failure, left sided , Chronic obstructive pulmonary disease , Lung abscess • Pulmonary alveolar proteinosis, Wegener's granulomatosis, Bronchiectasis • Pneumonia, Atypical pneumonia, Pulmonary hypertension • Measles, Oropharyngeal cancer, Goodpasture's syndrome • Pulmonary oedema, Pulmonary embolism, Mycobacterium tuberculosis • Foreign body in respiratory tract, Diffuse panbronchiolitis, Bronchogenic carcinoma • Broncholithiasis, Pulmonary fibrosis, Pneumocystis carinii • Captopril, Whooping cough, Fasciola hepatica • Gastroesophageal reflux, Schistosoma haematobium, Visceral leishmaniasis • Enalapril, Pharyngeal pouch, Suppurative otitis media • Upper respiratory tract infection, Arnold's nerve cough syndrome, Allergic bronchopulmonary aspergillosis • Chlorine gas, Amyloidosis, Cyclophosphamide • Tropical pulmonary eosinophilia, Simple pulmonary eosinophilia, Sulphur dioxide • Tracheolaryngobronchitis, Extrinsic allergic alveolitis, Laryngitis • Fibrosing alveolitis, cryptogenic, Toluene di-isocyanate, Coal worker's pneumoconiosis • Lisinopril, Functional disorders, Nitrogen dioxide, Fentanyl • Asthma, Omapatrilat, Sinusitis • Gabapentin, Cilazapril • ……diagnostic reasoning 53!
Diagnostic reasoning strategies • Aim: identify types and frequency of diagnostic strategies used in primary care • 6 GPs collected and recorded strategies used on 300 patients. (Diagnostic strategies used in primary care. Heneghan, Glasziou, Thompson et al,. BMJ in press)
Diagnostic stages & strategies Stage Strategy • Spot diagnoses • Self-labelling • Presenting complaint • Pattern recognition Initiation of the diagnosis Refinement of the diagnostic causes • Restricted Rule Outs • Stepwise refinement • Probabilistic reasoning • Pattern recognition fit • Clinical Prediction Rule Defining the final diagnosis • Known Diagnosis • Further tests ordered • Test of treatment • Test of time • No label
Diagnostic stages & strategies Stage Strategy • Spot diagnoses • Self-labelling • Presenting complaint • Pattern recognition Initiation of the diagnosis Refinement of the diagnostic causes • Restricted Rule Outs • Stepwise refinement • Probabilistic reasoning • Pattern recognition fit • Clinical Prediction Rule Defining the final diagnosis • Known Diagnosis • Further tests ordered • Test of treatment • Test of time • No label
Initiation: Spot diagnosis • Unconscious recognition of non-verbal pattern, e.g.: visual (skin condition) auditory (barking cough with croup) • Fairly instantaneous, no further history needed. • 20% of consultations *Brooks LR. Role of specific similarity in a medical diagnostic task. J Exp Psychol Gen 1991;220:278-87
“Its tonsillitis doc– I’ve had it before” “I have a chest infection doctor” 20% of consultations Accuracy of self-diagnosis in recurrent UTI 88 women with 172 self-diagnosed UTIs Uropathogen in 144 (84%) Sterile pyuria in 19 cases (11%) No pyuria or bacteriuira in 9 cases (5%) (Gupta et al Ann Int Med 2001) Initiation: Self-labelling
Stage Strategy • Spot diagnoses • Self-labelling • Presenting complaint • Pattern recognition Initiation of the diagnosis Refinement of the diagnostic causes • Restricted Rule Outs • Stepwise refinement • Probabilistic reasoning • Pattern recognition • Clinical Prediction Rule Defining the final diagnosis • Known Diagnosis • Further tests ordered • Test of treatment • Test of time • No label
Refining: Restricted rule-out (or Murtagh’s) process • A learned diagnostic strategy for each presentation • Think of the most common/likely condition • AND… what needs to be ruled out also? • Example: patient with headache …learn to check for migraine, tension type headache, but to rule out temporal arteritis, subarachnoid haemorrhage etc • Used in 30% consultations Murtagh. Australian Fam Phys 1990. Croskerry Ann Emerg Med 2003
Refining: Probabilistic reasoning • The use of a specific but probably imperfect symptom, sign or diagnostic test to rule in or out a diagnosis. • E.g. urine dipstick for UTI, arterial tenderness in Temporal Arteritis • Used 10% of cases
Refining: Pattern recognition • Symptoms and signs volunteered or elicited from the patient are compared to previous patterns or cases and a disease is recognized when the actual pattern fits. • Relies on memory of known patterns, but no specific rule is employed. • Used in 40% cases
Refining: Clinical prediction rules • Formal version of pattern recognition based on a well defined and validated series of similar cases. • Examples: Ottawa ankle rule, streptococcal sore throat, • Rarely used <10% cases
Stage Strategy • Spot diagnoses • Self-labelling • Presenting complaint • Pattern recognition Initiation of the diagnosis Refinement of the diagnostic causes • Restricted Rule Outs • Stepwise refinement • Probabilistic reasoning • Pattern recognition fit • Clinical Prediction Rule Defining the final diagnosis • Known Diagnosis • Further tests ordered • Test of treatment • Test of time • No label
Defining the final diagnoses 100% 90% 80% 70% 60% 50% 40% 30% 20% 10% 0% Known Diagnosis Further tests ordered Test of treatment Test of time No Label Final diagnostic stage • Known diagnosis • Order further tests • Test of treatment • Test of time • Can’t label
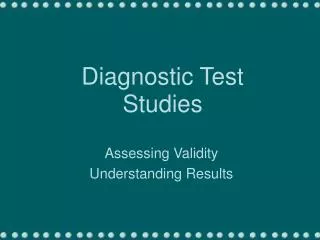
Appraising diagnostic tests 1. Are the results valid? 2. What are the results? 3. Will they help me look after my patients?
Appraising diagnostic tests 1. Are the results valid? 2. What are the results? 3. Will they help me look after my patients?
Basic design of diagnostic accuracy study Series of patients Index test Reference (“gold”) standard Blinded cross-classification
Validity of diagnostic studies 1. Was an appropriate spectrum of patients included? 2. Wereallpatients subjected to the gold standard? 3. Was there an independent, blind or objective comparison with the gold standard?
1. Was an appropriate spectrum of patients included? Spectrum bias Selected Patients Index test Reference standard Blinded cross-classification
1. Was an appropriate spectrum of patients included? Spectrum bias • You want to find out how good chest X rays are for diagnosing pneumonia in the Emergency Department • Best = all patients presenting with difficulty breathing get a chest X-ray • Spectrum bias = only those patients in whom you really suspect pneumonia get a chest X ray
2. Wereall patients subjected to the gold standard?Verification (work-up) bias Series of patients Index test Reference standard Blinded cross-classification
2. Wereall patients subjected to the gold standard?Verification (work-up) bias • You want to find out how good is exercise ECG (“treadmill test”) for identifying patients with angina • The gold standard is angiography • Best = all patients get angiography • Verification (work-up bias) = only patients who have a positive exercise ECG get angiography
3. Was there an independent, blind or objective comparison with the gold standard? Observer bias Series of patients Index test Reference standard Unblinded cross-classification
3. Was there an independent, blind or objective comparison with the gold standard? Observer bias • You want to find out how good is exercise ECG (“treadmill test”) for identifying patients with angina • All patients get the gold standard (angiography) • Observer bias = the Cardiologist who does the angiography knows what the exercise ECG showed (not blinded)
Incorporation Bias Series of patients Index test Reference standard….. includes parts of Index test Unblinded cross-classification
Differential Reference Bias Series of patients Index test Ref. Std A Ref. Std. B Blinded cross-classification
Validity of diagnostic studies 1. Was an appropriate spectrum of patients included? 2. Were all patients subjected to the Gold Standard? 3. Was there an independent, blind or objective comparison with the Gold Standard?
Appraising diagnostic tests 1. Are the results valid? 2. What are the results? 3. Will they help me look after my patients?
Sensitivity, specificity, positive & negative predictive values, likelihood ratios …aaarrrggh!!
2 by 2 table Disease + - + Test -
2 by 2 table Disease + - + a b Test d c -
2 by 2 table Disease + - a True positives b False positives + Test c False negatives d True negatives -
2 by 2 table: sensitivity Disease + - Proportion of people with the disease who have a positive test result. .…a highly sensitive test will not miss many people + a Test c - Sensitivity = a / a + c
2 by 2 table: sensitivity Disease + - + 99 Test 1 - Sensitivity = a / a + c Sensitivity = 99/100 = 99%
2 by 2 table: specificity Disease Proportion of people without the disease who have a negative test result. ….a highly specific test will not falsely identify people as having the disease. + - + b Test d - Specificity = d / b + d
Tip….. • Sensitivity is useful to me • Specificity isn’t….I want to know about the false positives …so……use 1-specificity which is the false positive rate
2 by 2 table: Disease + - + a b Test d c - False positive rate = b/b+d (same as 1-specificity) Sensitivity = a/a+c
2 by 2 table: Disease + - + 99 10 Test 90 1 - False positive rate = 10% (same as 1-specificity) Sensitivity = 99%
Example Your father went to his doctor and was told that his test for a disease was positive. He is really worried, and comes to ask you for help! • After doing some reading, you find that for men of his age: • The prevalence of the disease is 30% • The test has sensitivity of 50% and specificity of 90% • “Son, tell me what’s the chance I have this disease?”
100% Always • 50% maybe • 0% Never A disease with a prevalence of 30%. The test has sensitivity of 50% and specificity of 90%.
Prevalence of 30%, Sensitivity of 50%, Specificity of 90% Sensitivity = 50% Disease +ve 22 people test positive………. of whom 15 have the disease So, chance of disease is 15/22 about 70% 15 30 100 Testing +ve 7 70 Disease -ve False positive rate = 10%
Try it again • A disease with a prevalence of 4% must be diagnosed. • It has a sensitivity of 50% and a specificity of 90%. • If the patient tests positive, what is the chance they have the disease?
Prevalence of 4%, Sensitivity of 50%, Specificity of 90% Sensitivity = 50% Disease +ve 11.6 people test positive………. of whom 2 have the disease So, chance of disease is 2/11.6 about 17% 2 4 100 Testing +ve 9.6 96 Disease -ve False positive rate = 10%