Download
1 / 80
800 likes | 805 Views
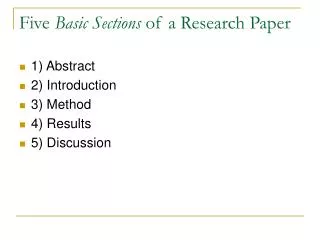
The Five Basic Institutions Five Basic Tasks. Instrumental. Government. Market. School. Church. Family. Relational. Buildings Reflect Society’s Fundamental Tasks. Government. Market. Church. School. Family. Fundamental Needs Of Society. Safety & Justice. Material Goods.

E N D
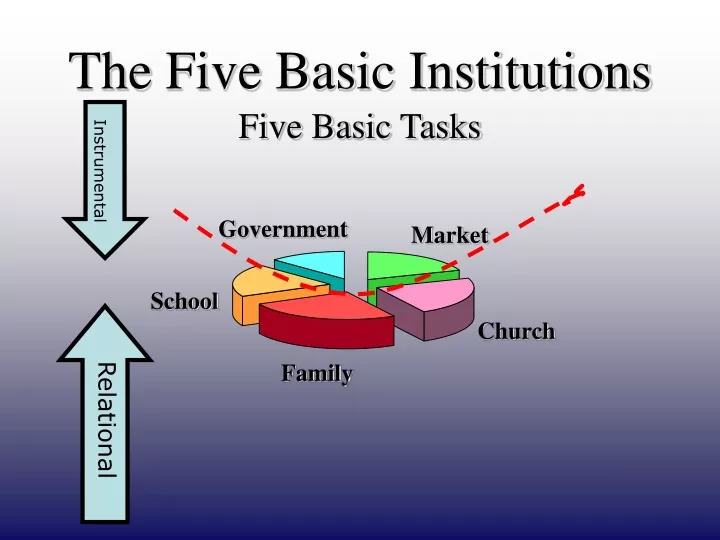
The Five Basic Institutions Five Basic Tasks Instrumental Government Market School Church Family Relational
Buildings Reflect Society’s Fundamental Tasks Government Market Church School Family
Fundamental Needs Of Society Safety & Justice Material Goods To Know Goodness & Meaning To Mate & Produce the Next Generation
Fundamental Capacities Force / Benevolence Work Intelligence Reflection Sexuality
Fundamental Tasks Of the Individual Gov Market School Church Family
Fundamental Tasks Of the Couple Gov Gov Market Market School School Church Church Family Family
Fundamental Tasks Of the Family Gov Market School Church Family Gov Gov Market Market School School Church Church Family Family
Fundamental Tasks Of Society Gov Market School Church Family Gov Market School Gov Church Market Family School Church Family Gov Market School Church Family
Belonging: Male + Female Society At Large Family Child / Adult Father Mother
The Non-Thriving Marriage / Child Relationship
Annual Rejection Ratio: For Every 100 Children Born Sources: CDC/ NCHS report series 60 40 20 10 0 90.0 Index of ~ 80.0 70.0 60.0 Divorce 50.0 40.0 30.0 20.0 10.0 OWB 0.0 1950 1955 1960 1965 1970 1975 1980 1985 1990 1995 1998 2000
Belonging and Rejection Ratio for the US, 2008 Source: Am. Comm Survey 2008 60 54.6 50 45.4 40 30 20 10 0 BELONGING REJECTION
Index of Belonging, Ethnic Groups Source: American Community Survey 2008 70.0% 62.0% 60.0% 53.8% 50.0% 45.4% 40.2% 40.0% 30.0% 23.8% 17.4% 20.0% 10.0% 0.0% U.S. Black American Indian & Hispanic Asian White Alaskan Native
Index of Belonging for the States Source: American Community Survey 2008 70.0 60.0 50.0 40.0 30.0 20.0 10.0 0.0 D M L A A G S N O N A K W M N S M O A M I U C W V O W M K V N C P M N M M N T N D E I N H I I L T X W I I D F L R I C T N E N J I A U T C S A R L A C M K V Z Y V O C D D R K S A A A H Y E S T Y O A T D A H N 48 46 47 49 16 41 42 32 34 37 37 38 39 39 40 40 40 42 42 42 42 42 43 43 43 44 45 45 45 45 45 46 47 47 47 48 48 49 49 49 49 50 52 53 54 54 55 55 57 58 59 52
International Rejection Ratio 100 90 U S 80 A 70 60 50 40 30 20 10 0 China Japan Taiwan France Croatia Finland Canada Georgia Sweden Uruguay Slovakia Jamaica Slovenia Portugal Denmark Lithuania Macedonia El Salvador Switzerland Netherlands New Zealand United States Czech Republic New Calcedonia Serbia and Montenegro
Belonging: Male + Female Society At Large Family Child / Adult Father Mother
Fundamental Institution: School School Need: Know & Understand Capacity: Intellect Task: Learn & Teach Strength: Truth & Tenacity School
GPA English/Math by Family Structure Source: Adolescent Health Survey, Wave I. Adolescents grade 7-12. 2.90 2.9 2.80 2.70 2.6 Average GPA Enligsh/Math Combined 2.6 2.6 2.60 2.5 2.5 2.50 2.40 2.30 INTACT STEP COHABIT (BOTH COHABIT (ONE DIVORCED NEVER MARRIED NATURAL) NATURAL)
Educational Attainment Ideal
Fundamental Institution: Marketplace Marketplace Need: Material Capacity: Work & Save Task: Produce & Exchange Habit: Work & Honesty Marketplace
Yearly Income, 2000, Families With Children Note: Figures do not include transferred income $60,000 $54,000 $50,000 $50,000 $40,000 $30,000 . $30,000 $23,000 $20,000 $20,000 $9,400 $9,100 $10,000 $0 First Marriage Second(+) Cohabitation Divorced Separated Widowed Never Married Marriage
Median Net Worth of Families With Children Under 18, 2000 Source: Survey of Consumer Finance, 2001 $140,000 $120,250 $120,000 $105,360 $100,000 $80,000 $60,000 $40,000 $27,800 $20,540 $16,540 $14,850 $20,000 $350 $0 First Marriage Second(+) Divorced Widowed Cohabitation Separated Never Married Marriage
Children in Poverty, 2000 80 67 70 60 50 Percent In Poverty 41 39 40 31 30 20 13 12 10 0 FIRST MARRIAGE SECOND(+) MARRIAGE DIVORCED COHABITATION SEPARATED NEVER MARRIED
Children in Poverty Unmarried Parents Same Parents Married 3.17 Million Children 3.93 Million Children Out ofPoverty InPoverty 0.75 Million Children Source R Rector: Analysis of CPS 2001
Marriage Premium in Male Income Source Antovics, K. & Town, R. Am Econ Review V 94, (2004) pp 317-321 $127 140 $100 120 100 80 Comparative Income % $27 60 + = 40 20 0 Average Unmarried Male Premium Average Married Male
Average Impact of Divorce on the Income of Households with Children Income $60,000 $54,000 $50,000 32 % $36,720 $40,000 Drop $30,000 $20,000 $10,000 $- Before Divorce After Divorce
Income: Economy $$$
Income Without Family Economy
Fundamental Institution: Government Government Need: Protection & Safety Capacity: Force & Law Task: Common Good Virtue: Justice & Goodwill Government
Family Structure: Comparative Rates Of Youth Incarceration 4 3.7 3.5 3 2.71 2.5 2.07 2 Comparative Rates of Incarceration 1.5 1 1 0.5 0 Raised in Intact Married Parent Raised in Mother-Only Family Raised in a Mother and Raised in a Stepmother Family Family Stepfather Family Source: C. Harper and S. McLanahan, “Father Absence and Youth Incarceration,” ASA Annual Meeting, San Francisco, August 1998. Data from the National Longitudinal Survey of Youth.
Adolescent Cocaine Use By Family StructureSource Add Health Wave II 1996
Runaway Children in UK Step-Families One-Parent Families Two-parent Families 0% 5% 10% 15% 20% 25% Percentage of children running away overnight before the age of 16
Relative Rates of Physical Abuse by Family Structure Source NIS-4, 2010 12 10.3 10 8 6 5.2 4.3 3.6 4 3.1 2 1.0 0 Step Cohabiting Step Married Always Intact Single Parent Not living with Intact Cohabiting Family Family Married Family Family either parent Family
Relative Rates of Sexual Abuse by Family Structure Source NIS-4, 2010 25 19.8 20 15 10.6 8.6 10 5 4.8 5 1 0 Single Parent Step Cohabiting Always Intact Intact Cohabiting Not living with Step Married Family Family Married Family Family either parent Family
U.S: Partner / Spouse Violence Against Mothers Over 20 With Children under 12 Source DOJ Nat Crime Victimization Survey 1999 35 33 30 25 20 15 Rate Per 1,000 15 10 6 4 5 0 Married Widowed Married+Div+Sep Never Married Combined
Fundamental Institution: Church Church Need: Good vs. Evil, & God Capacity: Reflection Task: Worship & Prayer Habit: Piety & Repentance Church
GPA (English & Math) by Religious Practice Source: Adolescent Health Survey, Wave I. Adolescents grade 7-12. 2.90 2.9 2.85 2.80 2.8 2.75 2.70 2.7 Average GPA Enligsh/Math Combined 2.65 2.6 2.60 2.55 2.50 2.45 WEEKLY+ MONTHLY+ <MONTHLY NEVER
Running Away by Church Attendance Source: Adolescent Health Survey, Wave I. Adolescents grade 7-12. 12.0% 11.5% 10.3% 10.0% 8.0% 7.3% 6.4% 6.0% Percent Who Had Ever Run Away 4.0% 2.0% 0.0% WEEKLY+ MONTHLY+ <MONTHLY NEVER
Times Drunk / Church Attendance Source: Adolescent Health Survey, Wave I. Adolescents grade 7-12.
Hard Drugs / Church Attendance Source: Adolescent Health Survey, Wave I. Adolescents grade 7-12.
Girls: Number of Sex Partners / Church Attendance Source: Adolescent Health Survey, Wave I. Adolescents grade 7-12.