Download
1 / 56
560 likes | 563 Views
Student Reflections as Data. Dr. Allyson Fiona Hadwin University of Victoria (EPLS & LTC) hadwin@uvic.ca. UBC Institute for the Scholarship of Teaching and Learning. Examining and Interpreting Data Collected over Time. Student reflection data Student interview data.

E N D
Student Reflections as Data Dr. Allyson Fiona Hadwin University of Victoria (EPLS & LTC) hadwin@uvic.ca UBC Institute for the Scholarship of Teaching and Learning
Examining and Interpreting Data Collected over Time • Student reflection data • Student interview data
Student Reflection Data • Journals • Portfolios • Reflection assignments
Why do you want to look at this data in the first place? What is your research question?
There are different kinds of research questions • Introducing the language so you know where to look beyond this course • Covered in many introductory research methods texts in education Creswell, J. W. (2005). Educational Research: Planning, conducting and evaluating quantitative and qualitative research. Upper Saddle River, NJ: Pearson-Merrill Prentice Hall.
Develop an understanding of what students gained through the experience (THEORY GENERATION) What are some possible models to explain student learning in this program? ? INDUCTIVE
Examine students' reflections according to theoretically driven constructs (THEORY DRIVEN) What kinds of sensitivities and awareness developed with respect to each of these issues: X, Y, Z? ? Theory verification
Understand the essence of student experiences of X. ? What is the meaning of this learning experience for students? Phenomenology
Compare students to one another ? How were these students’ experiences similar or different? Cross case study
Compare students to themselves at different points in time ? How did students change over the course of this instructional experience? Within case study
What kind of question do you have? Looking for something Top Down Bottom Up No idea what to expect
What is the question? • A characteristic of reflection data: • Usually interested in higher order, complex thinking • Critical thinking • Community awareness • Self-regulated learning • Difficult to operationalize and measure
Caution Data analysis and interpretation are limited (and afforded) by: • the kind of data you collected • how you collected the data • your own biases and roles in the process
Who is doing the analysis and interpretation? • Researcher • The student • Collaboration between researcher and student
Beginning steps in the analysis process • What is the unit of analysis • Organize data according to unit of analysis • Choose an analysis approach that is consistent with your research question
Unit of Analysis Individual Responses to questions or themes Timing of events Key Processes Key Events
Data Sets • Reflections on specific questions collected by Dr. Dana Damian (University of Victoria) • Reflections about studying and learning over 3 study sessions using computer based technologies for learning (collected by Allyson Hadwin)
Data sets • What unit of analysis might you choose for each data set? • Explain why?
Organize data • Make 2 copies of everything • Make sure identifier information is on each document (and unit) • Group data into the desired unit of analysis • Choose an appropriate analytic approach
Semi-structured or Loosely structured? • Semi-structured • Responses to specific questions • Reflections on particular themes • Loosely structured • Open discussion • Reflections about learning without specific criteria
Which data set is: • Semi structured? • Loosely structured?
Analytic approaches • Content analysis • Case study • Inductive analysis • Narrative analysis • Phenomenological analysis • Grounded theory analysis
Combining analytic approaches • Often these analytic approaches are combined. • I describe each separately to give you a sense of the main focus
Content Analysis • Code (from theory or data) • Pull apart • Re-construct according to categories and themes • Summarized numerically & with quotes • Build theory and explanation • Not very sensitive to context of statements and ideas
Narrative Analysis • Preserves the whole • represents the perspective of the “teller” • Themes in context • Researcher voice appears in explanation and representation • Many of the participants words included
Case Study Analysis • Assemble all sources data for one case (reflection, interviews, etc) • Construct a case record –classifying and editing raw data into an accessible package • Write a case narrative (organized chronologically or thematically, or both) • Pattern matching (comparing theoretically predicted patterns to data based patterns) • Explanation building (theory building) • Time series analysis –trends over time
Inductive analysis • Themes emerging from the data • Also top down sensitizing from the researcher • Movement toward typologies • Synthesis and explanation of typologies
Grounded Theory analysis • Fine-grained analysis of small units (sentences or phrases) • description • conceptual ordering • theorizing is interplay between data and theory • asking questions and making comparisons throughout • layers of coding from micro-analysis to modelling • iterative inductive cycle with specific stages • Constant comparative approach • Saturation
Phenomenological analysis • -examining or uncovering the essence of a experience or behaviour • -involves exploration of personal biases • -looking for what is "real” & teasing apart judgment • -bracketing or identifying data in its pure form • Epochè -look inside at personal bias • Phenomenological reduction -bracketing from the world and all presuppositions • Horizontalizing -data spread out for interpretation • Structural synthesis -deeper meaning or essence of phenomenon is revealed
Important elements of analysis • Systematic approach (open about and describe the approach) • Coding data • Description • Conceptual Ordering • Higher order analysis or theorizing Strauss and Corbin (Grounded theory)
Steps for your analysis • Focus your analysis • Organize your data • Decide upon and justify the appropriate way to attack or analyze the data? • (coding) • Conceptually organize data (try 2 different ways of presenting findings to bring meaning to themes)
Coding • Marking segments of data with symbols, descriptive words, labels or names • Keep a master list of codes, their meaning, examples, & non-examples • Theory driven • Data driven
Description • Emerges from coding the data • What does the data say • What is important • What are the patterns? • What are basic stories
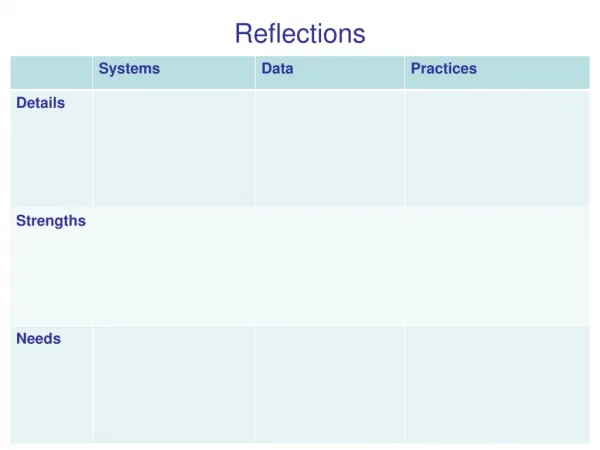
Conceptual Ordering -logical analysis • Creating categories, finding means for identifying and displaying themes • Keeping an eye toward interpretation • Must be careful - once you start organizing data according to a frame it becomes difficult to let go and try something different when it is not working • Matrixes • Concept maps • Summary tables • Diagrams
Data may be organized: • Time ordered • Role ordered • Role by time ordered • Role by group • Conceptually clustered • Site dynamics • Predictor - outcome • Process -outcome • see Miles & Huberman (1984) for details
Interpretation -Theory • Focus is illumination, extrapolation, and understanding • Does not focus on cause and consequence • Going beyond the data to connect with theory or to generate theory/explanation • Dealing with rival explanations, disconfirming cases, and data irregularities
Group activity • What have students learned about their learning through the computer based learning activity
Analyzing data activity • Focus your analysis • Organize your data • Decide upon and justify the appropriate way to attack or analyze the data? • (coding) • Conceptually organize data (try 2 different ways of presenting findings to bring meaning to themes)
When a theoretical frame informs your analysis • Coding scheme comes from the theory • For example, you can use a rubric to analyze (and assess) deeper level thinking Top Down
Working with theory driven constructs • Defining your construct • From the data (inductive) • From the theory (lens for the data) • Rubrics • Content analysis
An Example from Critical Thinking VanGyn, G., Ford, C., & Associates (2005). Teaching Critical Thinking. Unpublished manuscript.
Critical Thinking Rubric • Interviewed faculty • Examined critical thinking assignments • looking for ways to define and assess critical thinking
Key Dimensions of critical thinking • Intellectual habits • Intellectual deliberations • Reflexive Disposition
Intellectual habits • Intellectual curiosity • Respect for truth and reason • Fair and open mindedness • Tolerance for ambiguity • Intellectual courage to take a position • Intellectual work ethic • Willingness to engage in collaborative inquiry
Intellectual deliberations • Identify the challenge, situation or task • Gather, interpret and understand background information & evidence • Apply thinking strategies relevant to the type of inquiry relevant to the challenge • Generate or select alternatives • Make evaluative judgments among alternatives based on criteria • Provide justification for the conclusion