Download
1 / 10
100 likes | 195 Views
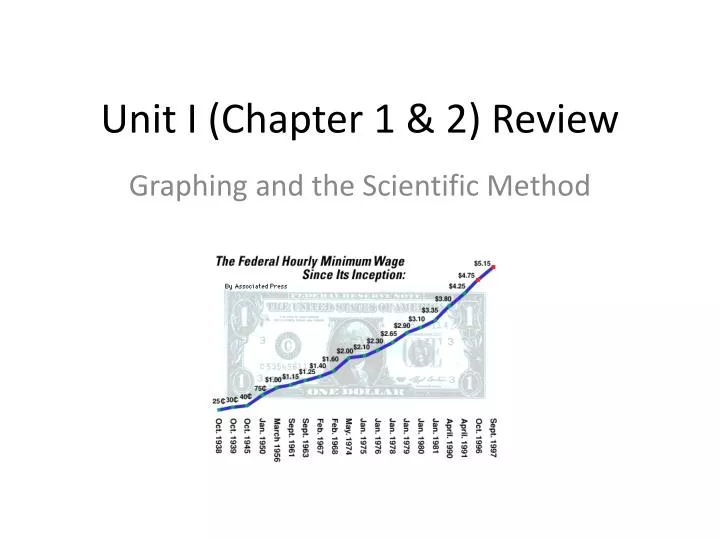
Unit I (Chapter 1 & 2) Review. Graphing and the Scientific Method. What type of graph is this? What would be a good title for this graph? What is the range of the x-axis? The y-axis? What does the x-axis “go by”? The y-axis? What is this graph showing?

E N D
Unit I (Chapter 1 & 2) Review Graphing and the Scientific Method
What type of graph is this? • What would be a good title for this graph? • What is the range of the x-axis? The y-axis? • What does the x-axis “go by”? The y-axis? • What is this graph showing? • Is this adirect or indirect relationship? Weak or strong? • What is the label for the x-axis? The y-axis • What are the units for the x-value? The y-value? • What is the dependent variable? Independent variable? Temperature of Helium (°C)
A student performs the following experiment: • A toy car with 100 grams mass in it is rolled down a ramp three times. Here are the results: 0.78 seconds, 0.79 seconds, and 0.81 seconds. The average is 0.80 seconds. • The same toy car is then rolled down three times with 200 grams mass in it. Here are the results: 0.77 seconds, 0.80 seconds, and .81 seconds. The average is 0.79 seconds. • What might have been her hypothesis for his experiment? • What is the dependent (responding) variable? Independent (manipulated) variable? • What would be a good title for this experiment? • List three controls she should have. • What is the resolution of the stopwatch she used? • Is her data precise? Why? • How might she not objective in this experiment? • What type of graph would be appropriate for this data? Why? • What conclusion can you make from the data?
Design • Design an experiment to determine if the orange car will take less time to go down a ramp than a blue car.
Was Mr. Jansen’s experiment on a bike with 26 inch wheels vs. a bike with 29 inch wheels valid? • Why or why not? • What is wrong with saying? • “I have a theory. Aliens on Mars are probably red in color.” • Convert 356 mm to cm. • Convert 0.0000043 kg to mg.