Download
1 / 7
80 likes | 214 Views
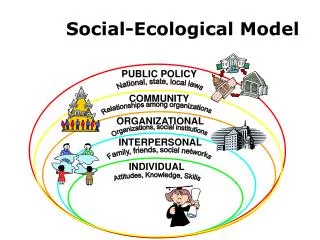
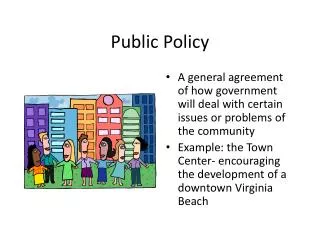
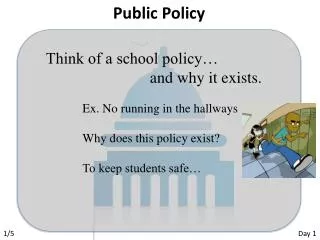
Public Policy. Results from battles among citizens, groups, and public officials Determines who gets what, where, and how Shapes future outcomes Creates arrangements that confer advantages to some political actors and disadvantages to others

E N D
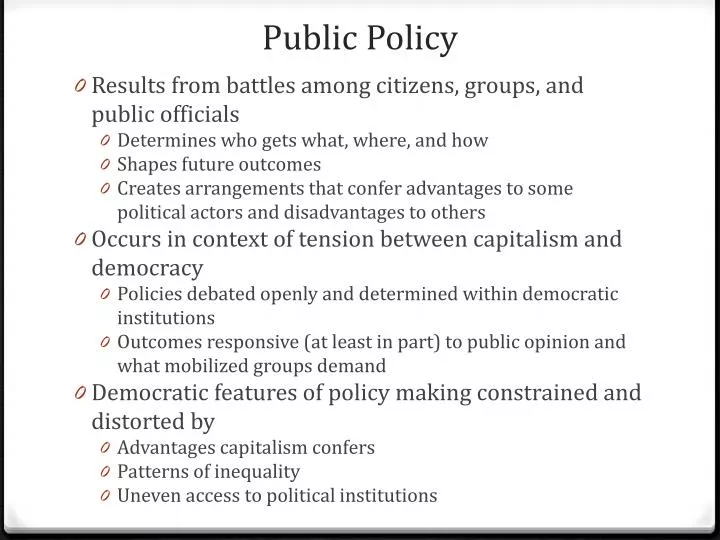
Public Policy • Results from battles among citizens, groups, and public officials • Determines who gets what, where, and how • Shapes future outcomes • Creates arrangements that confer advantages to some political actors and disadvantages to others • Occurs in context of tension between capitalism and democracy • Policies debated openly and determined within democratic institutions • Outcomes responsive (at least in part) to public opinion and what mobilized groups demand • Democratic features of policy making constrained and distorted by • Advantages capitalism confers • Patterns of inequality • Uneven access to political institutions
Economic Policy • Gross Domestic Product (GDP) = total goods and services produced • Government has grown since 1950s (Table 9.1) • increasing activities of government (social welfare and defense) • Size of government small in comparison • Tax burden light: lower % of GDP in form of taxes (Figure 9.1) • Spends less as % of GDP (Figure 9.2) • Leaner benefits and fewer public services • Small public sector employment • Government lacks power to manage economy and significantly influence behavior of private firms • Corporate managers enjoy greater autonomy • Firms subject to fewer government regulations • Modes and institutional constraints: Fiscal (budget) and monetary policy (interest rates) • Fiscal policy divided between Congress and President • Monetary policy controlled by “independent” Federal Reserve Board (FED)
Fiscal Policy • Manipulates total amount of government revenue and spending to manage overall demand • Budget deficits stimulate economy (unemployment) • Budget surpluses restrain economy (inflation) • Budget more than fiscal tool – establishes priorities and values of government • Determines winners and losers; distributes costs and benefits • Reveals relationships of power • Budget process involves partisan, institutional, and interest group conflict • Starts with President and goes to Congress (budget committees) • Appropriations bills emerge and are sent to President
Taxes • Highly contentious – level, types, shares • Receipts rose from 1983-2000 (20% GDP) • Bush’s tax cuts reversed trend (16.5% by 2003) • Decline in revenue, rising federal deficits => debt payments strain government’s ability to provide services • Federal government (Table 9.2) • Corporate income taxes declined (loopholes, credits, accounting gimmicks, shelters); supposed to be 35% (not 20%) • Excise taxes (alcohol, cigarettes, gas) down • Social Security payroll taxes up • Progressive (rich pay larger proportion of income) or Regressive (tax rates same regardless of income)? • Regressive (Figure 9.3): tax burden roughly same for all income groups • Incentives through exemptions, rebates, deductions (mortgage interest; depreciation for equipment; IRAs) • Tax expenditures = public subsidies through favored tax treatment; not as visible; less likely to arouse conflict • “subterranean politics” results in very complex tax code
Spending • Groups struggle over how much should be spent; what it should be spent on • Government expenditures have increased (1950, 15.6% of GDP; 2008, 21%) • Government does more (Social Security; Medicare/Medicaid; EPA; other functions) • Federal outlays for defense and welfare (Table 9.3) • Welfare state expenses account for 63.6% of all spending (2008) • Welfare and warfare account for 93% of all outlays • All other tasks get remaining 7% • 2/3 of all government spending mandatory (debt, entitlement programs (e.g., Social Security, food stamps, Medicare)) • 1/3 discretionary spending (jurisdiction of Appropriations Committees) • Largest is defense (1/2 of all discretionary spending)
Monetary Policy • Manipulation of interest rates, cost of money • High rates slow economy; low rates encourage borrowing, spending • Differential impact on groups • Controlled by Federal Reserve Board (FED) • Determines interest rate banks pay to borrow money (low rates increase money supply) • Buys and sells government bonds (puts more money into circulation) • Sets reserve rate banks must hold on deposits (higher rates decrease money supply) • FED (created in 1913) substantial autonomy (independence from Congress and President) insulates monetary policy from democratic control • Subject to capture by banks => representatives in policymaking bodies; mobilization of bias (what is good for banks is good for economy) • Changes under Bernanke (took over from Greenspan, 2008) • Support for regulation of financial sector; FED lender of last resort • Purchases and guarantees (over $5 trillion) dwarfs bailout money • More active, more regulatory oversight, more investments (make it more target of lobbying, jeopardizes independence) • Remains very cozy with financial sector (What’s good for Wall Street is good for America)
Regulation • Authorized by Congress, bureaucracy sets rules firms must follow • U.S. has comparatively low level of government regulation • Government regulation necessary because markets are not self-regulating, will not protect public interest and social values • Progressive and New Deal Eras (first wave) popular pressure prompted government to create economic regulation for specific industries (prices, standards, competition, licenses) • Interstate Commerce Commission (1887) – regulate railroad rates and routes • Federal Trade Commission (1914) – protect consumers from unfair business practices • Food and Drug Administration (1931) – protect consumers from tainted foods, harmful drugs • Securities and Exchange Commission (1934) – protect investors from fraud • Agencies often captured by industry; “revolving door”; serve interests of industry rather than public • Second wave (1960s) demanded social regulation, across industries (antidiscrimination, environmental regulations, workplace safety) • Civil rights agencies – protect against discrimination • Environmental Protection Agency (1970) – develop/enforce environmental standards • Occupational Safety and Health Administration (1970)– establish/monitor workplace safety and health standards • Consumer Products Safety Commission (1972) – ensure product safety • Prompted counteroffensive by business community calling for “regulatory reform” • Ongoing conflict over standards, enforcement, and industry capture