Download
1 / 23
270 likes | 541 Views
Nature of Air Pollution in India. Dr. Sarath Guttikunda. Air Pollution in Indian Cities. 27. Cities in Top 100 with the worst air quality. WHO (2011, 2013). Air Pollution in Indian Cities. Ludhiana Kanpur Delhi Lucknow Indore Agra Kolkata Faridabad Jabalpur. Mumbai Dhanbad

E N D
Nature of Air Pollution in India Dr. Sarath Guttikunda
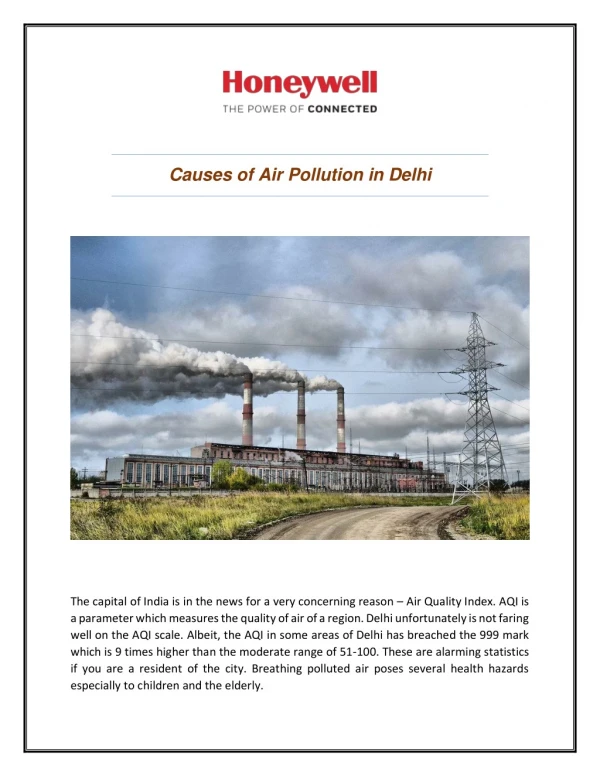
Air Pollution in Indian Cities 27 Cities in Top 100 with the worst air quality WHO (2011, 2013)
Air Pollution in Indian Cities Ludhiana Kanpur Delhi Lucknow Indore Agra Kolkata Faridabad Jabalpur Mumbai Dhanbad Allahabad Patna Meerut Jaipur Varanasi Pune Nagpur Bhopal Vijayawada Bangalore Rajkot Hyderabad Vizag Surat Ahmedabad Nashik WHO, 2011 27 PM10 WHO guideline = 20mg/m3
Air Pollution in Indian Cities 6th GBD 2010 (IHME, 2013) ~695,000 premature deaths ~100,000 from household combustion
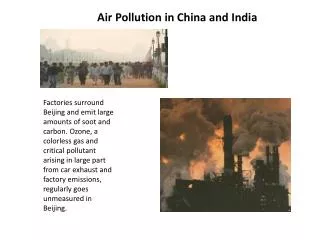
Long List of Anthropogenic and Natural Sources power plants construction garbage burning industries road dust vehicle exhaust domestic fuels
National Transport Emissions 2011-12 120 million registered vehicles More @ http://www.urbanemissions.info
National Transport Emissions 2010-30 More @ http://www.urbanemissions.info
National Transport Emissions 2010 & 2030 2010 2030
Sectoral Linkages – Power Plants 112 coal-fired power plants More @ http://www.urbanemissions.info
Coal unloading on to the conveyor belt at North Chennai PP
Coal, Ore, Cement, Fertilizers, Salt, Sugar Road vs. Rail Freight Movement??
Sectoral Linkages – Freight Rohtang pass, Himachal Pradesh
Sectoral Linkages – Brick Kilns Chennai, ~550 Pune, ~400 Ahmedabad, ~400 Delhi, ~800
Sectoral Linkages – Brick Kilns • Indo-Gangetic Region • Transport • Rural biomass cooking • Agricultural • Industries • Brick kilns • PM10
Sectoral Linkages – Urban MoUD, 2008
Sectoral Linkages – Urban MoUD, 2008
Sectoral Linkages – Urban MoUD, 2008
Sectoral Linkages – Urban MoUD, 2008
On-road Idling Pollution Ludhiana Delhi Vizag 20% Driving time is spent idling for passenger cars Car moving speeds in Delhi – km/hr 20 min of idling for cars = Rs. 1 crores in fuel losses (~$200,000) per day Goel & Guttikunda, 2013
On-road Moving Pollution 25% On road BC to PM2.5 ratio (in 2010) Apte et al., 2011 On road measurements from 2010 % vehicle pollution to PM2.5 in Delhi More @ http://www.urbanemissions.info
National Transport Emissions 2010-30 ? More @ http://www.urbanemissions.info
Thank you More @