Download
1 / 25
250 likes | 387 Views
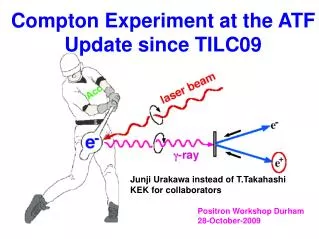
Progress and Future Plans of the BNL ATF Compton Source. Oliver Williams University of California, Los Angeles. Outline. Simulation and characterization of source by absorption in foils Attempts at phase contrast imaging (PCI) New endeavors

E N D
Progress and Future Plans of the BNL ATF Compton Source Oliver Williams University of California, Los Angeles
Outline • Simulation and characterization of source by absorption in foils • Attempts at phase contrast imaging (PCI) • New endeavors • A look at source polarimetry and electro-optic sampling
Simulated x-ray spectra Tail from e-beam angles ICS spectra for various acceptance angles (0.5 to 10 mrad) at 65 MeV and Δγ/γ=1.0%. ICS spectra on-axis (1 mrad accepted)and the effects of e-beam energy spread. Reducing to 0.1% spread results in the dominance of beam angles on the bandwidth. Note: Code does not include nonlinear effects
Simulated intensity distribution before and after foil Off-axis red-shifting “Undulator equation”
Analyzing the photons 250 μm Be-window Insertable Ni, Fe, and Ag foils MCP image intensifier (CCD camera not pictured) 1 mradpinhole on remote 2-axis control Remotely insertable Si-diode detector 250 μm Be-window
Ex far above Fe K-edge MCP No foil Iron foil Low energy photons preferentially attenuated Ni K-edge 1.2 keV higher than Fe Nickel foil Silver foil
72 MeV 70 MeV 68 MeV
65 MeV 66 MeV 64 MeV
Lobe observation angle ΔEe=1.3 MeV => ΔEx= 290 eV • Max simulated lobe intensity shows peak at 6.9 keV • Fit simulation curve to data by adding energy offset (~290 eV) • Energy offset could be due to absolute e-beam energy calibration or nonlinear induced red-shifting (aL>0)
Measured on-axis flux and BW • Need ~65 MeV e-beam to create ≤1 mrad null (with <50% photons transmitting on-axis) • ΔE= 1.3 MeV = 290 eV => BW = 4.0% • Measured ~2x10⁶ photons through 1 mrad pinhole placed on-axis • Bpeak= 1018-1019 in pulses from 4 ps to 300 fs
Circular polarization and sub-ps pulses 68 MeV, 4 ps FWHM e-beam (2Δγ/γ=ΔE/E=1%) 68 MeV, 300 fs FWHM e-beam (2Δγ/γ=ΔE/E=2%)
Phase Contrast Imaging (PCI) • Different index of refraction results in interference effects • Produces edge enhancement • Require small source sizes (10’s of microns)
1st attempts at PCI No edge enhancement MCP taken image, 500 μm PET Zoomed intensity lineout Phase peaks Full profile lineout Simulated lineout
Upgrades for successful PCI • Detector better suited to many keV x-rays • Hamamatsu CMOS detector • 50 micron/pixel • Direct detection and image processing • Carbon-fiber window = req. >10 keV x-rays • Upgraded linac: 72 to now 85 MeV max • Up to 13 keV x-rays (fundamental) • Smaller divergence angle (6 mrad) • Helium-filled transport line between object and detector increased signal by x3 for ~11.5 keV
Recent attempts at PCI • Wires of various material and diameter characterized • Preliminary analysis shows obvious edge enhancement and good agreement with simulations • “Vespa” starlet shown; tomographic centerfold coming soon!
Possible new endeavors • Two-color digital subtraction imaging • Medical apps, cultural heritage (e.g. paint on canvas) • Verifying ICS polarization rate • Polarized positrons • Polarization-dependent materials (e.g. XMCD) • Polarization of harmonics? • Electro-optic sampling • Non-destructive bunch length measurement • Time stamping of x-ray pulse arrival for pump-probe experiments (e.g. non-thermal melting requires sub-ps x-rays)
Polarization analyzer • Index of refraction, n~1 for x-ray energies • Yields Brewster’s (polarization) angle ~45o for x-rays • At this angle only s-pol x-rays are reflected • Consider in-hand silicon crystal
Analyzer cont. • Si (111) crystal, 333 symmetric reflection • 8.39 keV photons, Bragg angle ~ 45o , same as Brewster • Rotate crystal about beam axis (χ-angles) • Circular pol yields constant signal J. Samson, Rev. Sci. Instr., Vol. 47, pp 859-860
Electro-optic sampling • Use nonlinear crystal (e.g. ZnTe <110>) • E-field of electron bunch imprinted on crystal • Acts as polarization gate • resolution: probe laser pulse length and crystal thickness • window: crystal width and laser spot size • Provocation based on measurements done at UCLA Pegasus Lab
e- beam and laser parametersin comparison • Pegasus • Laser • Ti:Sapphireregen. • 0.800 µm • 40 fs FWHM • 3 mJ(<5% needed) • e- beam • 200 fs rms • < 10 pC • 3.5 MeV • BNL ATF • Laser • Nd:YLF • 1.047µm • 200fs FWHM • 100 µJ • e- beam • 150fs rms • 300pC • 80MeV
EO effect comparison • The peak current (thus peak E fields) are larger for the ATFbeam (Q/L) = ~ 2pC/fs@ BNL ATF, ~ 0.05 pC/fs@ Pegasus • The opening angle of the fields (~ 1/γ) is smaller by a factor of 80MeV/3.5 MeV = 23 Conclusion: • The EO-effect signal is much larger for the ATF beam
Summary • ATF Compton source characterized: • ~2x10⁶ photons over 1 mrad • 4-5% bandwidth • 0.3-4 ps x-ray pulses (assuming equal bunch length) • Linear or circularly polarized x-rays • Easily tunable photon energy, 6 to 9keV (13 keV since upgrade) • Bpeak=1018-1019 photons/s/mm2/mrad2 (0.1% BW) • Phase contrast imaging can be done with ICS (given good detector) • Next up: Two-color subtraction, source polarization rate, and electro-optic sampling Thanks! VitalyYakimenko and ATF staff, Massimo Carpinelli and Co., UCLA, and of course, the audience