Download
1 / 26
260 likes | 548 Views
Final Effluent Monitoring. Application & Product Data. Wastewater or Industrial Effluent Treatment Plant. River. Final Settlement. Tertiary Treatment Plant. Effluent Monitoring. Why is Effluent Monitoring Important?. Tertiary Treatment Control. River. Effluent. From upstream process.

E N D
Final Effluent Monitoring • Application & Product Data
Wastewater or Industrial Effluent Treatment Plant River Final Settlement Tertiary Treatment Plant
Tertiary Treatment Control River Effluent From upstream process Clarifier Clarifier Tertiary Treatment Return to upstream process UV, Sand Filter, Membrane Plant or similar • Monitoring at allows the operator to inhibit use of the tertiary treatment system when: • The effluent is of a good quality and further treatment is not required • The effluent is too poor a quality and could damage the tertiary treatment plant
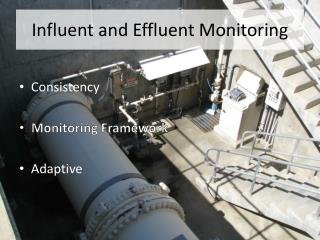
Ensure Success – Pick your Location ? • Find • Representative sample point of the process • Well mixed sample • Safe to reach sensors • Avoid • Dead Zone • Extreme Turbulence • Other Instrumentation • Hazardous access to sensor • Reaching over handrails
Sensors in Flumes Ultrasonic Level Sensor for flow measurement Flow Where should the Turbidity or pH sensor go?
Sensor in Flumes Not here – to turbulent and can’t guarantee level Ultrasonic Level Sensor for flow measurement Flow Not here – it would interfere with level measurement Upstream of ultrasonic sensor, in controlled flow area
Sensors in Weir Boxes Not here – to turbulent and can’t guarantee level Ultrasonic Level Sensor for flow measurement Not here – to turbulent Inlet Outlet Flow V-Notch Weir Plate Not here – it would interfere with level measurement Upstream of ultrasonic sensor, in controlled flow area
Why Measure Effluent Turbidity • Turbidity is recognised as an excellent general indicator of process performance • Increasing Turbidity provides an early warning of a failure in the treatment process • Increasing Turbidity can give a surrogate indication of an increase in more complex measurements such as BOD and COD • Increasing Turbidity highlights problems with Pin Floc created by overdosing of Flocculation and Coagulation chemicals such as Aluminium and Iron Salts used for P Removal
Suspended Solids or Turbidity • Turbidity • Suspended Solids • Comparable site to site • Represents each site • Ease of calibration • Matches consent rule
Why Measure Effluent pH • Another general indicator of process performance • pH outside of normal ambient levels indicates that the effluent is likely to be toxic • Varying pH indicates that the process is out of control • A drift to either high or low pH can indicate that under or overdosing is occurring in the process • Sudden changes indicate that a major incident or change in plant loading has occurred
UV254 – OPM and UV Transmissivity • Measurement of UV light at 254nm cannot be universally applied BUT • For some effluents it will provide a low cost alternative to an online COD analyser • Good for: Nitrate not for Ammonia • Good for organics containing a Benzene Ring (Aromatic) compound • Often referred to a SAK(C) – spectral Absorption Coefficient • Provides an output in mg/l Carbon • UV Transmissivity will provide a control signal to modulate or inhibit UV treatment
WaterWatch² Partech’s versatile electronics platform 7300w2 Monitor
7300w² and 7200w² Monitor / Controller • Advanced Features • 1 or 2 sensor input. • Multiple Parameter Capability via optional interface unit. • Graphic display with trending • USB Interface for data logging for each measurement. • Fully Featured Dosing Control. PID plus. • Conventional or Profibus output. • Triple validation option • Low Power Operation, ability to lay dormant when intermittent sampling is required. • Easy to use menu structure.
Suspended Solids – TurbiTechw² LS Sensor Concentration C Light Intensity I Light Intensity Io Rugged & Robust sensor designed for the application
Angus Fosten - Sales and Marketing Director Mobile: +44 (0) 776 846 5581 Email: angus@partech.co.uk Andrew Wallace - Field Sales Engineer Mobile: 0777 815 0118 Email: andrew@partech.co.uk Clive Teobald - Sales Engineer Mobile: 0796 601 3446 Email: clive@partech.co.uk David Wilson- Export Sales Manager Mobile: +44 (0) 7968 603155 Email: david.wilson@partech.co.uk Jan Johnson - Sales Administrator Email: jan@partech.co.uk