Download
1 / 20
200 likes | 329 Views
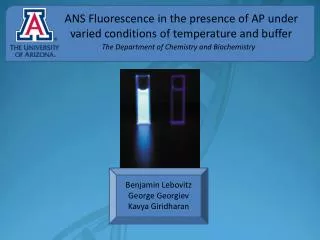
Effects of Urea and Temperature on Fluorescence of AP. Annette Gorelik and Brandon Freidhof. Objectives of Experiment. Initially – To determine the temperature needed to denature AP in urea Later – To determine the effects of urea and temperature on the fluorescence of Trp. Fluorescence.

E N D
Effects of Urea and Temperature on Fluorescence of AP Annette Gorelik and Brandon Freidhof
Objectives of Experiment • Initially – To determine the temperature needed to denature AP in urea • Later – To determine the effects of urea and temperature on the fluorescence of Trp
Fluorescence • Shine a light, exciting Trp • Trp glows, count photons emitted • Emission changes with solvent environment • Solvent environment changes with protein confirmation • Changes in confirmation can be observed as changes in emission
Methods • Two cuvettes – 1 for urea, 1 for buffer • Starting at room temperature, cuvettes were heated to 80C, with scans taken every 10C • In ‘buffer’ cuvette – 1 mL of equilibration soln. (6mM Tris, pH 7.4, 5mM MgCl2) + enough AP to have 5uM concentration at final volume • In ‘urea’ cuvette – 1mL urea (8M urea in buffer) + enough AP to have 5uM concentration at final volume • Fluorometer conditions: • Excitation wavelength: 295nm • Scan interval: 303nm-400nm • Slit width: 0.5mm (2)
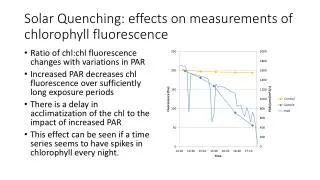
Expectations Pace, C.N. (1986)
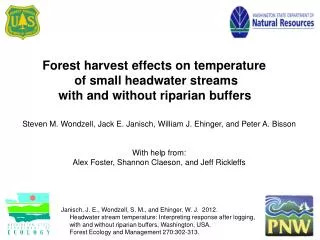
Expectations, cont. Khav et. al. (2011)
New Methods • Initial results – not much happening • Take same 2 cuvettes, bring to 45C, measure spectra every 10 minutes, watch for change
Newer Methods • Last scans at 60C were increasing in intensity • New plan: take urea cuvette, hold at 60C, monitor every 10 minutes to see what happens • Also, check fluorescence of Trp in buffer and urea (these made the same way as the AP solns.)
Further Methods • AP had steady increase; Trp showed increase in presence of urea at room temp. • 10 sets of soln. prepared with 0uM, 5uM, 10uM, 15uM, and 20uM Trp; one of each concentration in urea, one in buffer • Measured fluorescence at room temp • Also measured 0uM and 15uM at 60C
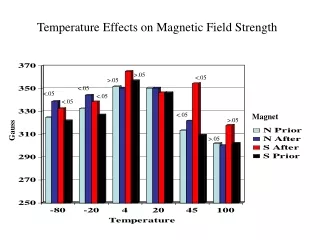
Discussion • Urea – can’t tell what it does to AP with this tool • Urea – increases fluorescence of Trp • Temperature – inversely related to fluorescence • Known from prior work, due to increased interactions of Trp with environment • Counter indicates fluorescence in studies with changing temperature?
Further Research • Look at urea + AP + temp with CD (think this was done by morning group) • Try with reduced AP, see if that’s more successful
References • Pace, C. N. "Determination and Analysis of Urea and Guanidine Hydrochloride Denaturation Curves." Methods in Enzymology 131 (1986). Print • Khav, Eddie, et. al. “Evaluation of denaturation of alkaline phosphatase by means of fluorescence spectroscopy” BIOC 463A course website (Fall 2011). Powerpoint