Download
1 / 26
260 likes | 387 Views
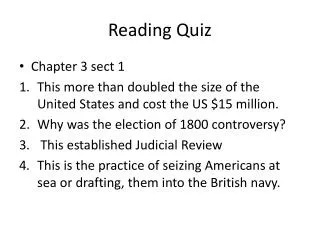
Reading Quiz. The quantity 2.67 x 10 3 m/s has how many significant figures? 1 2 3 4 5. Slide 1-7. Answer. The quantity 2.67 x 10 3 m/s has how many significant figures? 1 2 3 4 5. Slide 1-8. 1 Representing Motion. Slide 1-2. Four Types of Motion We’ll Study. Slide 1-13.

E N D
Reading Quiz • The quantity 2.67 x 10³ m/s has how many significant figures? • 1 • 2 • 3 • 4 • 5 Slide 1-7
Answer • The quantity 2.67 x 10³ m/s has how many significant figures? • 1 • 2 • 3 • 4 • 5 Slide 1-8
1Representing Motion Slide 1-2
Four Types of Motion We’ll Study Slide 1-13
Making a Motion Diagram Slide 1-14
Examples of Motion Diagrams Slide 1-15
The Particle Model A simplifying model in which we treat the object as if all its mass were concentrated at a single point. This model helps us concentrate on the overall motion of the object. Slide 1-16
Position and Time The position of an object is located along a coordinate system. At each time t, the object is at some particular position. We are free to choose the origin of time (i.e., when t = 0). Slide 1-17
Displacement The change in the position of an object as it moves from initial position xi to final position xf is its displacement ∆x = xf – xi. Slide 1-18
Checking Understanding • Maria is at position x = 23 m. She then undergoes a displacement ∆x = –50 m. What is her final position? • –27 m • –50 m • 23 m • 73 m Slide 1-19
Answer • Maria is at position x = 23 m. She then undergoes a displacement ∆x = –50 m. What is her final position? • –27 m • –50 m • 23 m • 73 m Slide 1-20
Checking Understanding Two runners jog along a track. The positions are shown at 1 s time intervals. Which runner is moving faster? Slide 1-21
Answer Two runners jog along a track. The positions are shown at 1 s time intervals. Which runner is moving faster? A Slide 1-22
Checking Understanding Two runners jog along a track. The times at each position are shown. Which runner is moving faster? They are both moving at the same speed. Slide 1-23
Answer Two runners jog along a track. The times at each position are shown. Which runner is moving faster? They are both moving at the same speed. Slide 1-24
40 m m 1 s s 20 m m 1 s s Speed of a Moving Object The car moves 40 m in 1 s. Its speed is = 40 . The bike moves 20 m in 1 s. Its speed is = 20 . Slide 1-25
Velocity of a Moving Object Slide 1-26
Example Problem At t 12 s, Frank is at x 25 m. 5 s later, he’s at x 20 m. What is Frank’s velocity? Slide 1-27
Vectors A quantity that requires both a magnitude (or size) and a direction can be represented by a vector. Graphically, we represent a vector by an arrow. The velocity of this car is 100 m/s (magnitude) to the left (direction). This boy pushes on his friend with a force of 25 N to the right. Slide 1-32
Displacement Vectors A displacement vector starts at an object’s initial position and ends at its final position. It doesn’t matter what the object did in between these two positions. In motion diagrams, the displacement vectors span successive particle positions. Slide 1-33
Exercise Alice is sliding along a smooth, icy road on her sled when she suddenly runs headfirst into a large, very soft snowbank that gradually brings her to a halt. Draw a motion diagram for Alice. Show and label all displacement vectors. Slide 1-34
Adding Displacement Vectors Slide 1-35
Example Problem: Adding Displacement Vectors Jenny runs 1 mi to the northeast, then 1 mi south. Graphically find her net displacement. Slide 1-37
Velocity Vectors Slide 1-38
Example: Velocity Vectors Jake throws a ball at a 60° angle, measured from the horizontal. The ball is caught by Jim. Draw a motion diagram of the ball with velocity vectors. Slide 1-39