Download
1 / 8
80 likes | 209 Views
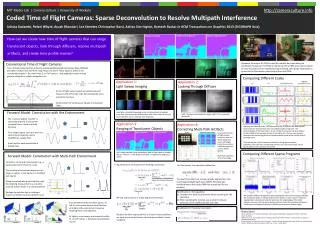
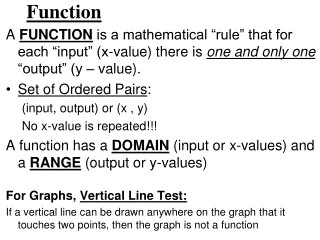
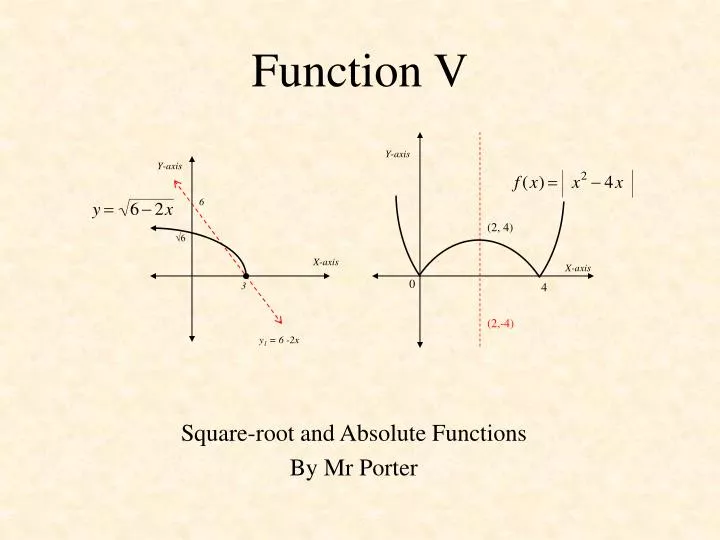
Y-axis. Y-axis. 6. √6. X-axis. X-axis. 0. 3. (2,-4). (2, 4). y 1 = 6 -2x. 4. Function V. Square-root and Absolute Functions By Mr Porter. Square-Root Function:.

E N D
Y-axis Y-axis 6 √6 X-axis X-axis 0 3 (2,-4) (2, 4) y1 = 6 -2x 4 Function V Square-root and Absolute Functions By Mr Porter
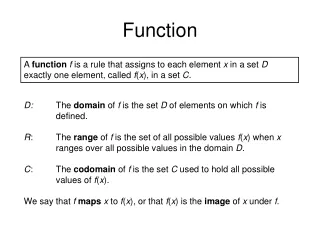
Square-Root Function: The function, , is equivalent to half of a horizontal parabola and has similar graphing features. Example Consider the function: , , squaring both sides The important feature of this function is that f(x) must be a ZERO or POSITVE value, otherwise the function is undefined in the real number system. We will at this stage of the course, restrictf(x) to be linear functions, such as f(x) = 2x + 3 or f(x) = 4 - x. y2 = x – 5 , re-arrange to make x the subject. x = y2 + 5 , which is the form of a horizontal parabola. The important fact in this example is that: x – 5 ≥ 0, to have any real answer. This means, the Domain is x ≥ 5 for all x in R, and the Range is y ≥ 0 for all y in R.
Example 2: Sketch Hence, state clearly the functions domain and range. Graphing : To sketch , start with y = f(x). Example 1: Sketch Hence, state clearly the functions domain and range. Sketch the graph of y = 2x - 5. Sketch y1 = 6 - 2x on the number plane. Now, take the square-root, top half of a parabola Now, take the square-root, top half of a parabola left. y1=2x-5 Y-axis Y-axis 6 X-axis √6 2.5 X-axis -5 3 y1 = 6 -2x Remember, down here y = 2x - 5 is negative! Solution: Find domain first, solve 6 – 2x ≥ 0 -2x ≥ -6 This mean the curve goes to the left. x ≤ 3 Domain is found by solving 2x - 5 ≥ 0 Domain: all x ≥ 2.5 in R Range: All y ≥ 0 in R Domain: all x ≤ 3 in R Range: All y ≥ 0 in R
Because of the (–) in-front of the square-root, the curve goes under. Now, sketch the square-root curve to the right, starting at x = -1. Slide the curve up 5! Slide the curve up 2! y y = x+1 y1= 2x- 4 y2= 5 y = 2 2 -1 x Harder Examples: Sketch the graph of the following function and clear state the domain and range of each. Sol: Find domain first, solve x +1 ≥ 0 Sol: Find domain first, solve 2x - 4 ≥ 0 2x – 4 ≥ 0 ==> x ≥ 2 , curves to the right . x +1 ≥ 0 ==> x ≥ -1 , curves to the right . Sketch y1 = 2x – 4 on the same number plane and y2 = 5. Sketch y1 = x + 1 on the same number plane and y2 = 2. Domain:All x ≥ -1 in R Range:All y ≥ 2 in R Domain:All x ≥ 2 in R Range:All y ≤ 5 in R
y y y -6 x -3 x 5 2 -√6 x -2 4 Exercise: For each of the following: a) Sketch the function b) Define the domain and range of the function Domain: all x ≤ 4 in R Range: all y ≥ 0 in R Domain: all x ≥ -6 in R Range: all y ≤ 0 in R Domain: all x ≥ -3 in R Range: all y ≥-2 in R
Step 1: Sketch f(x) = 2x – 3 Step 1: Sketch f(x) = x2 - 4x Step 2: at the x-intercept, reflect graph UP. Step 2: at the x-intercepts, reflect negative part of graph UP. y (2, 4) 3 0 4 11/2 x (2,-4) -3 Absolute Value Functions. y = | f(x) | The absolute symbols | .. | given the value as a POSITIVE number, as in distance. Examples: Sketch and define domain and range. Domain: all x in R Range: all y ≥ 0 Domain: all x in R Range: all y ≥ 0
Step 1: Sketch f(x) = , asymptote at x = 1, y = 0 Step 1: Sketch f(x) = , asymptote at x = 1, y = 0 Step 2: Reflect the positive part of the graph DOWN below the x-axis. Step 2: Reflect the negative part of the graph UP above the x-axis. 2 2 1 1 -2 -2 More Examples [An absolute graph can be NEGATIVE] Domain: all x in R, x ≠ 1 Range: all y in R, y > 0 Domain: all x in R, x ≠ 1 Range: all y in R, y < 0
4 2 Domain: all x in R Range: all y ≥ 0 in R Domain: all x in R, x ≠ 1.5 Range: all y ≥ 0 in R, y ≠ 0 4 (2,16) -2 2 Domain: all x in R Range: all y ≥ 0 in R 2 -4 -2 6 Domain: all x in R Range: all y ≥ 0 in R (2,-16) Exercise: For each function: i) Sketch the Function ii) Write down the domain and range. Note: f(x) = |(x - 2)(x + 2) | Note: f(x) = |(x - 6)(x + 2) |