Download
1 / 13
130 likes | 233 Views
Physiological Impacts of Climate Change Using Remote Sensing David S Wethey /University of South Carolina. Your institution logo here. How can physiology inform species distribution models? Approach Examine difference between lethal vs performance limits

E N D
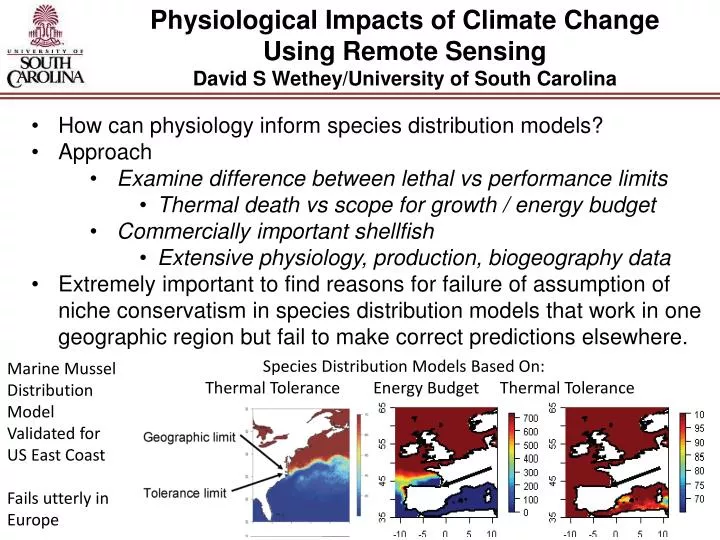
Physiological Impacts of Climate Change Using Remote SensingDavid S Wethey/University of South Carolina Your institution logo here • How can physiology inform species distribution models? • Approach • Examine difference between lethal vs performance limits • Thermal death vs scope for growth / energy budget • Commercially important shellfish • Extensive physiology, production, biogeography data • Extremely important to find reasons for failure of assumption of niche conservatism in species distribution models that work in one geographic region but fail to make correct predictions elsewhere. Species Distribution Models Based On: Thermal Tolerance Energy Budget Thermal Tolerance Marine Mussel Distribution Model Validated for US East Coast Fails utterly in Europe
Transient Event Margin This is the difference between the upper physiological performance limit Ctmax of a species and its lethal thermal limit Ltmax We believe that niche models will be well conserved geographically in species with small TEM, and such models will fail spectacularly when TEM is large. We are using modeling and experimental measurements of performance to test this idea. Performance Metrics Growth rate Scope for Growth Reproduction Feeding rate Burrowing rate Heart rate Respiration rate
Biophysical Modeling of Intertidal Body Temperatures NOAH Mussel Model Good predictor of Intertidal Body Temps Gridded climate reanalysis products differ a great deal in their utility for biophysical modeling . CFSR (global) and NARR (N America) almost as good as local data. Wetheyet al. 2011. Ecological Modelling 222:3568-3576 Mislan & Wethey 2011. Ecological Applications 21: 2678-2690
Quality of Gridded Remotely Sensed daily SST Relative to in situDataloggers Robolimpets in Europe, Robomussels in Chile Analysis of daily GHRSST products. Bias in R/S SST increases in upwelling regions and in upwelling seasons Chile errors are greater than elsewhere for this reason. Lima, Broitman, Seabra, Wethey
SST reconstructions and forecasts are essential to our modeling efforts Global distribution of seasonal rates of change of SST from remote sensing. 71% of coastlines are warming. 46% have decrease in frequency of extreme cold events. Hot days are becoming more common in 38% of coasts. Warm season is beginning earlier In the year in 36% of coasts. http://coastalwarming.com Change in Hot days (d/decade) Change in Cold days (d/decade) Change in timing of warming Lima & Wethey, 2012. Nature Communications 3:704
Measures of Physiological Performance Linked to Biogeography Scope For Growth (Assimilation – Respiration) drops below zero at high temperatures in 3 species of mussels SST rarely exceeds zero SFG threshold in locations where these species are found Fly and Hilbish
Scope for Growth Models incorporating daily SST and reanalyzed Chlorophyll Yield the correct southern limit of Mytilusedulis in Europe Reanalysis Chlorophyll µg/L End of Year body mass via SFG UKMO Reanalysis Field measurements of growth rate underway around UK to validate models Wethey, Fly, Hilbish
Energy Budget Models are very sensitive to environmental fluctuations: Daily temperature dynamics influence growth and reproduction Kearney, Matzelle, Helmuth 2012. J Exp Biology 215:922-933
Predator-Prey interactions are affected by daily fluctuations in environmental conditions – feeding rates of starfish are lower in fluctuating conditions than in constant conditions Pincebourde, Sanford, Casas, Helmuth 2012. Ecology Letters
Rapid Large Scale Geographic Change is occurring on intertidal shores • Subtropical mussels in Europe expanding northward 50 km / decade in parallel with warming winters. • Hilbish et al. 2012. J Biogeography 39:676-687 • Boreal barnacles on US East coast contracted northward 350 km since 1960 in parallel with increasing frequency of lethal conditions in south • Jones, Southward, Wethey. 2012. Global Ecology & Biogeography in press • Boreal mussels on US East coast contracted northward 350 km since 1960s parallel with increasing frequency of lethal conditions in south • Jones, Lima, Wethey. 2010. J. Biogeography 37:2243-2259 • Boreal barnacles on European coast reversed northward contraction after cold winters of 2009-10 and 2010-11 caused increased reproductive output: expansion of up to 200 km in 4 different geographic regions • Wethey et al. 2011. J Exp. Marine Biology & Ecology 400:132-144 • Subtropical mussels on US West coast reversed northward expansion during cold phase of Pacific Decadal Oscillation: contraction of 200 km • Hilbish et al. 2010. Journal of Biogeography 37:423-431.
Biogeography controlled by climate and dispersal The barnacle Semibalanusbalanoidesdoes not reproduce when there are fewer than 30-45 days below 10°C in winter Several warm decades led to low populations in SW England, but the winters of 2009-10 and 2010-11 were cold, and there was rapid expansion of populations in SW England Days below 10°C Rognstad, Hilbish, Wethey
Modeling Larval Dispersal as Lagrangian Particles with Ocean Models as Basis for Biogeographic Metapopulation Models Cohorts of 50 larvae projected using Euler’s method Eddy diffusion simulated from Okubo’s 1972 ocean diffusion rates at each time step Large differences among trajectories of larvae released from same location on same day in simulations using different models: HYCOM, MARS3D, IBI-NEMO, UKMet-NEMO Validating surface velocities with GTS drifter buoy data Wethey, Rognstad, Oliver, Hilbish
Research Team David Wethey – PI biogeography and modeling Sarah Woodin – CoI ecological performance Jerry Hilbish– CoI scope for growth Brian Helmuth– CoI dynamic energy budgets Venkat Lakshmi - CoI ocean color Postdocs Fernando Lima (Europe – SST, heart rate ) Nils Volkenborn (USA - performance) Gonzalo Macho (Europe - performance) Mackenzie Zippay (USA – heart rate) Current Grad Students Rhiannon Rognstad – biogeography UK Elizabeth Fly – scope for growth Cristian Monaco – dynamic energy budgets Nicholas Colvard – energetics Nicole Kish – biophysical model validation Jessica Price – ocean color and SST RuiSeabra (Univ Porto) – biogeography Overseas Collaborators Gian-Luca Sara, U Palermo - DEB Stan Dubois, IFREMER – biogeography Bernardo Broitman, Chile - SST Technician Allison Matzelle – DEB models Undergrads Nicholas Burnett – heart rate sensors Hilde Oliver – larval dispersal models Shadow Fockler – biophysical models