Download
1 / 39
390 likes | 552 Views
GEOLOGY 324 TECTONOPHYSICS: EARTHQUAKES & TECTONICS Seth Stein, Northwestern University. INTEGRATE COMPLEMENTARY TECHNIQUES TO STUDY LITHOSPHERIC DEFORMATION Each have strengths & weaknesses Important to understand what can & can’t do Jointly give valuable insight. Introduction

E N D
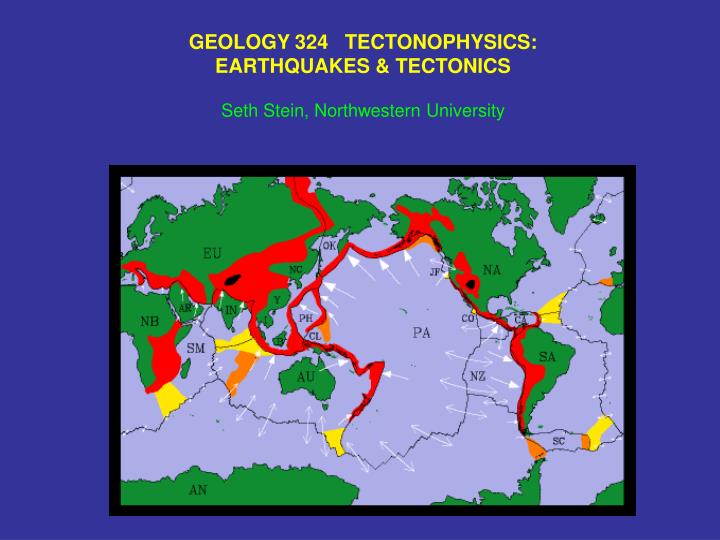
GEOLOGY 324 TECTONOPHYSICS: EARTHQUAKES & TECTONICS Seth Stein, Northwestern University
INTEGRATE COMPLEMENTARY TECHNIQUES TO STUDY LITHOSPHERIC DEFORMATION Each have strengths & weaknesses Important to understand what can & can’t do Jointly give valuable insight
Introduction Earthquakes: fundamental concepts & focal mechanisms Earthquakes: waveform modeling, moment tensors & source parameters Tectonic geodesy Earthquake recurrence & hazards Plate tectonics, relative plate motions Absolute plate motions Spreading centers, Subduction zones & driving forces Plate boundary zones & changes in plate motions Plate interiors Faulting & deformation in the lithosphere
Class notes: http://www.earth.northwestern.edu/people/seth/324 Most material from Stein, S. and M. Wysession, Introduction to Seismology, Earthquakes, and Earth Structure, Blackwell Publishing, 2003.
Studying the lithosphere involves integrating plate tectonics, seismology, geodesy, geology, rock mechanics, thermal studies, modeling and much moreNo clear dividing lines between subfields“When we try to pick out anything by itself, we find it hitched to everything else in the universe.”John Muir “Half of what we will teach you in the next few years is wrong. The problem is we don’t know which half” Medical school dean to incoming students
EARTHQUAKES & TECTONICS Locations map plate boundary zones & regions of intraplate deformation even in underwater or remote areas Focal mechanisms show strain field Slip & seismic history show deformation rate Depths constrain thermo-mechanical structure of lithosphere NORTH AMERICA 36 mm/yr PACIFIC San Andreas Fault, Carrizo Plain
PLATE KINEMATICS, directions and rates of plate motions Can observe directly Primary constraint on lithospheric processes PLATE DYNAMICS, forces causing plate motions Harder to observe directly Observe indirect effects (seismic velocity, gravity, etc) Studied via models Closely tied to mantle dynamics Kinematics primary constraint on models
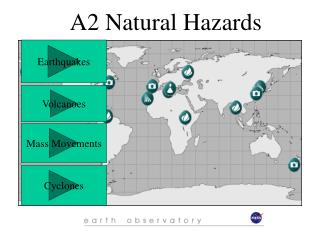
EARTHQUAKES & SOCIETY In general, the most destructive earthquakes occur where large populations live near plate boundaries. The highest property losses occur in developed nations where more property is at risk, whereas fatalities are highest in developing nations. Estimates are that the 1990 Northern Iran shock killed 40,000 people, and that the 1988 Spitak (Armenia) earthquake killed 25,000. Even in Japan, where modern construction practices reduce earthquake damage, the 1995 Kobe earthquake caused more than 5,000 deaths and $100 billion of damage. On average during the past century earthquakes have caused about 11,500 deaths per year. The earthquake risk in the United States is much less than in many other countries because large earthquakes are relatively rare in most of the U.S. and because of earthquake-resistant construction
Hazard is the intrinsic natural occurrence of earthquakes and the resulting ground motion and other effects. Risk is the danger the hazard poses to life and property. Although the hazard is an unavoidable geological fact, risk is affected by human actions. Areas of high hazard can have low risk because few people live there, and areas of modest hazard can have high risk due to large populations and poor construction. Earthquake risks can be reduced by human actions, whereas hazards cannot Bam, Iran earthquake: M 6.5 30,000 deaths San Simeon, Ca earthquake: M6.5 2 deaths Earthquakes don’t kill people (generally, tsunami exception), buildings kill people NATURAL DISASTERS: HAZARDS AND RISKS
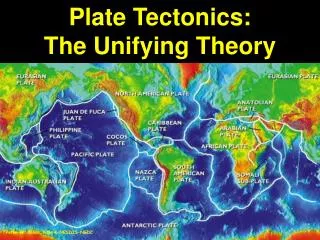
Earthquake locations map narrow plate boundaries, broad plate boundary zones & regions of intraplate deformation even in underwater or remote areas DIFFUSE BOUNDARY ZONES INTRAPLATE NARROW BOUNDARIES Stein & Wysession, 2003 5.1-4
BASIC CONCEPTS: KINEMATICS CONTROL BOUNDARY NATURE S&W 5.1-4 Direction of relative motion between plates at a point on their boundary determines the nature of the boundary. At spreading centers both plates move away from boundary At subduction zones subducting plate moves toward boundary At transforms, relative plate motion parallel to boundary Real boundaries often combine aspects (transpression, transtension) Arabia 4 mm/yr Sinai Transtension - Dead Sea transform
NOMENCLATURE: • Boundaries are described either as • midocean-ridges and trenches, emphasizing morphology • or as divergent (spreading centers) and convergent (subduction zones), emphasizing kinematics • Latter nomenclature is more precise because there are • elevated features in ocean basins that are not spreading ridges • spreading centers like the • East African rift within continents • continental convergent zones like the Himalaya may not have active subduction • etc
EULER VECTOR Relative motion between two rigid plates on the spherical earth can be described as a rotation about an Euler pole At a point r along the boundary between two plates, with latitude and longitude , the linear velocity of plate j with respect to plate i , v ji , is given by the vector cross product v ji = j i x r r is the position vector to the point on the boundary j i is the angular velocity vector or Euler vector described by its magnitude (rotation rate) |j i | and pole(surface position)(, ) Linear velocity r Stein & Wysession, 2003
Direction of relative motion is a small circle about the Euler pole First plate ( j) moves counterclockwise ( right handed sense) about pole with respect to second plate (i). Boundary segments with relative motion parallel to the boundary are transforms, small circles about the pole Segments with relative motion away from the boundary are spreading centers Segments with relative motion toward boundary are subduction zones Magnitude (rate) of relative motion increases with distance from pole because |v ji | = |j i | | r | sin , where is the angle between pole and site All points on a boundary have the same angular velocity, but the magnitude of linear velocity varies from zero at the pole to a maximum 90º away. 21 2 wrt 1 12 1 wrt 2 Stein & Wysession, 2003
BOUNDARY TYPE CHANGES WITH ORIENTATION PACIFIC - NORTH AMERICA CONVERGENCE - ALEUTIAN TRENCH 54 mm/yr PACIFIC wrt NORTH AMERICA pole STRIKE SLIP - SAN ANDREAS EXTENSION - GULF OF CALIFORNIA Stein & Wysession, 2003 5.2-3
SAN ANDREAS FAULT NEAR SAN FRANCISCO Type example of transform on land
1989 LOMA PRIETA, CALIFORNIA EARTHQUAKE MAGNITUDE 7.1 ON THE SAN ANDREAS Davidson et al
1989 LOMA PRIETA, CALIFORNIA EARTHQUAKE The two level Nimitz freeway collapsed along a 1.5 km section in Oakland, crushing cars Freeway had been scheduled for retrofit to improve earthquake resistance
1989 LOMA PRIETA, CALIFORNIA EARTHQUAKE Houses collapsed in the Marina district of San Francisco Shaking amplified by low velocity landfill Stein & Wysession 2003 2.4-10 (USGS)
TRENCH-NORMAL CONVERGENCE - ALEUTIAN TRENCH 54 mm/yr 1964 ALASKA EARTHQUAKE Ms 8.4 Mw 9.1 Pacific subduction beneath North America ~ 7 m of slip on 500x300 km2 of Aleutian Trench Second or third largest earthquake recorded to date ~ 130 deaths Catalyzed idea that great thrust fault earthquakes result from slip on subduction zone plate interface NORTH AMERICA PACIFIC
1971 Ms 6.6 SAN FERNANDO EARTHQUAKE 1.4 m slip on 20x14 km2 fault Thrust faulting from compression across Los Angeles Basin Fault had not been previously recognized 65 deaths, in part due to structural failure Prompted improvements in building code & hazard mapping
Los Angeles Basin Thrust earthquakes indicate shortening 1994 Northridge Ms 6.7 Caused some of the highest ground accelerations ever recorded. It illustrates that even a moderate magnitude earthquake can do considerable damage in a populated area. Although the loss of life (58 deaths) was small due to earthquake-resistant construction the $20B damage makes it the most costly earthquake to date in the U.S. AFTTERSHOCKS S&W 4.5-9
ELASTIC REBOUND OR SEISMIC CYCLE MODEL Materials at distance on opposite sides of the fault move relative to each other, but friction on the fault "locks" it and prevents slip Eventually strain accumulated is more than the rocks on the fault can withstand, and the fault slips in earthquake Earthquake reflects regional deformation S&W 4.1-3
ELASTIC REBOUND OR SEISMIC CYCLE MODEL Earthquakes are most dramatic part of a seismic cycle occuring on segments of the plate boundary over 100s to 1000s of years. During interseismic stage, most of the cycle, steady motion occurs away from fault but fault is "locked", though some aseismic creep can occur on it. Immediately prior to rupture is a preseismic stage, that can be associated with small earthquakes (foreshocks) or other possible precursory effects. Earthquake itself is coseismic phase, during which rapid motion on fault generates seismic waves. During these few seconds, meters of slip on fault "catch up" with the few mm/yr of motion that occurred over 100s of years away from fault. Finally, postseismic phase occurs after earthquake, and aftershocks and transient afterslip occur for a period of years before fault settles into its steady interseismic behavior again.
1906 SAN FRANCISCO EARTHQUAKE (magnitude 7.8) ~ 4 m of slip on 450 km of San Andreas ~2500 deaths, ~28,000 buildings destroyed (most by fire) Catalyzed ideas about relation of earthquakes & surface faults Boore, 1977 S&W 4.1-2
SEISMIC CYCLE AND PLATE MOTION Over time, slip in earthquakes adds up and reflects the plate motion Offset fence showing 3.5 m of left-lateral strike-slip motion along San Andreas fault in 1906 San Francisco earthquake ~ 35 mm/yr motion between Pacific and North American plates along San Andreas shown by offset streams & GPS Expect earthquakes on average every ~ (3.5 m )/ (35 mm/yr) =100 years Turns out more like 200 yrs because not all motion is on the San Andreas Moreover, it’s irregular rather than periodic
EARTHQUAKE RECURRENCE IS HIGHLY VARIABLE Reasons are unclear: randomness, stress effects of other earthquakes on nearby faults… Sieh et al., 1989 Extend earthquake history with paleoseismology M>7 mean 132 yr s 105 yr S&W 1.2-15
CHALLENGES OF STUDYING EARTHQUAKE CYCLE • Cycle lasts hundreds of years, so don’t have observations of it in any one place • Combine observations from different places in hope of gaining complete view • Unclear how good that view is and how well models represent its complexity. • Research integrates various techniques: • Most faults are identified from earthquakes on them: seismology is primary tool to study the motion during earthquakes and infer long term motion • Also • Historical records of earthquakes • Field studies of location, geometry, and history of faults • Geodetic measurements of deformation before, during, and after earthquakes • - Laboratory results on rock fracture
GEODETIC DATA GIVE INSIGHT INTO DEFORMATION BEYOND THAT SHOWN SEISMOLOGICALLY Study aseismic processes Study seismic cycle before, after, and in between earthquakes, whereas we can only study the seismic waves once an earthquake occurs SAR image of Hayward fault (red line), part of San Andreas fault system, in the Berkeley (east San Francisco Bay) area. Color changes from orange to blue show about 2 cm of gradual movement. This movement is called aseismic creep because the fault moved slowly without generating an earthquake
ELASTIC REBOUND MODEL OF STRIKE-SLIP FAULT AT A PLATE BOUNDARY Large earthquakes release all strain accumulated on locked fault between earthquakes Coseismic and interseismic motion sum to plate motion Interseismic strain accumulates near fault Stein & Wysession, 2003 4.5-12
ELASTIC REBOUND MODEL OF STRIKE-SLIP FAULT AT A PLATE BOUNDARY Fault parallel interseismic motion on fault with far field slip rate D, locked to depth W, as function of cross-fault distance y s(y) = D/2 + (D / π) tan -1 (y/W) Width of strain accumulation zone comparable to locking depth
FAR FIELD SLIP RATE D ~ 35 mm/yr S&W 4.5-13 Z.-K. Shen
PACIFIC-NORTH AMERICA PLATE BOUNDARY ZONE: PLATE MOTION & ELASTIC STRAIN ~ 50 mm/yr plate motion spread over ~ 1000 km ~ 35 mm/yr elastic strain accumulation from locked San Andreas in region ~ 100 km wide Locked strain will be released in earthquakes Since last earthquake in 1857 ~ 5 m slip accumulated Broad PBZ Elastic strain Stein & Sella 2002
EARTHQUAKE CYCLE INTERSEISMIC: India subducts beneath Burma at about 20 mm/yr Fault interface is locked EARTHQUAKE (COSEISMIC): Fault interface slips, overriding plate rebounds, releasing accumulated motion and generating tsunami SUMATRA TRENCH BURMA INDIA Tsunami generated Stein & Wysession, 2003 4.5-14 HOW OFTEN: Fault slipped ~ 10 m --> 10000 mm / 20 mm/yr = 500 yr Longer if some slip is aseismic Faults aren’t exactly periodic, likely because chaotic nature of rupture controls when large earthquakes occur
TSUNAMI GENERATED ALONG FAULT, WHERE SEA FLOOR DISPLACED, AND SPREADS OUTWARD Hyndeman and Wang, 1993 Red - up motion, blue down http://staff.aist.go.jp/kenji.satake/animation.gif
SEISMIC WAVES COMPRESSIONAL (P) AND SHEAR (S) WAVES P waves longitudinal waves S waves transverse waves P waves travel faster S waves from earthquake generally larger Stein & Wysession, 2003
EARTHQUAKE LOCATION Least squares fit to travel times Accuracy (truth) depends primarily on velocity model Precision (formal uncertainty) depends primarily on network geometry (close stations & eq within network help) Locations can be accurate but imprecise or precise but inaccurate (line up nicely but displaced from fault) Epicenters (surface positions) better determined than depths or hypocenters (3D positions) because seismometers only on surface
IMPROVE EARTHQUAKE LOCATION Precision can be improved by relative location methods like Joint Epicenter Determination (JED) or master event Dewey, 1987 Or via better velocity model, including methods that simultaneously improve velocity model (double-difference tomography)
IMPROVE EARTHQUAKE LOCATION Precision can be improved by relative location methods like Joint Epicenter Determination (JED) or master event Dewey, 1987 Or via better velocity model, including methods that simultaneously improve velocity model (double-difference tomography)