Download
1 / 21
210 likes | 225 Views
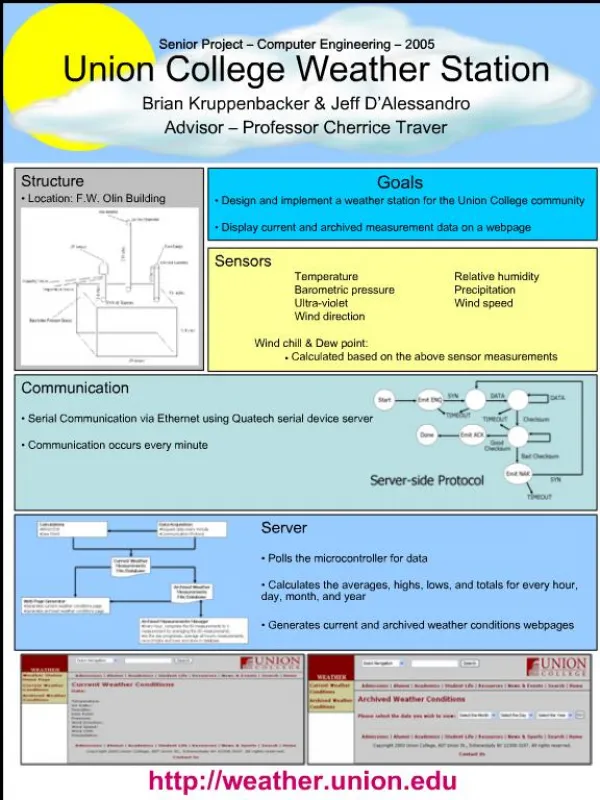
UNION COLLEGE WEATHER STATION. Brian Kruppenbacker Jeffrey D’Alessandro Advisor: Professor Traver. Goals. Design and implement a weather station for the Union College campus community Record Temperature Relative humidity Barometric pressure Precipitation UV index Wind speed

E N D
UNION COLLEGEWEATHER STATION Brian Kruppenbacker Jeffrey D’Alessandro Advisor: Professor Traver
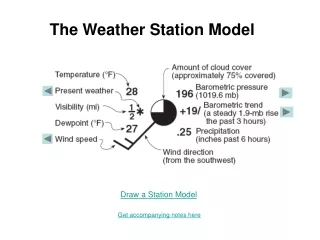
Goals • Design and implement a weather station for the Union College campus community • Record Temperature Relative humidity Barometric pressure Precipitation UV index Wind speed Wind direction • Calculate Wind chill & Dew point • Display current and archived measurement data at weather.union.edu
Performance Criteria • Measurements must have accuracy within 5% • The measurements must represent the current weather conditions • The computer must store the measurement data for future reference • The system must be able to run for a long period of time (years) • The station must be low maintenance • Any malfunctions must be easy to fix
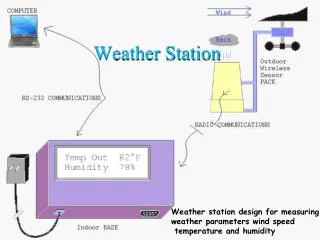
Behavior • Sensor station located on roof of F.W. Olin building will record measurements • Sensor station sends data to a computer • Computer will perform the additional calculations needed • Computer will store all measurements • Computer will generate webpage to display most recent measurements • Webpage will allow users to view archived measurement data Sensor Station Hard Drive
Our Design Sensor Station Structure Communication Server
DIGITAL Based on number of pulses Precipitation Wind Speed ANALOG Based on voltage Temperature Relative Humidity Barometric Pressure Ultra-Violet Wind Direction Types of Sensors
Sensors: Analog • 8051 Microcontroller Analog to Digital Converter • All sensor outputs were adjusted to fit between the range of 0 and 2.5 volts through the use of voltage dividers • The voltage division is then taken into account when the measurements are calculated
Sensors: Digital • 8051 Microcontroller Programmable Counter Array • Signal bounce is handled using both software and hardware approaches • Measurements are calculated based on the number of pulses and the number of pulses within a time frame • Pulses are counted using interrupts
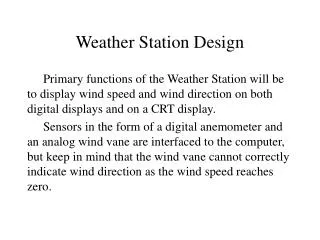
Sensor Station: Microcontroller Start Setup Precepitation and Wind Speed (Interrupts) Get Temperature Get Relative Humidity _____ Get Barometric Pressure ENQ Get UV Get Wind Direction Check for ENQ ENQ Turn off Interrupts Send Data If sent correctly, reset Precip and Wind Speed Counters Turn Interrupts back on
Location: F.W. Olin Building Power: 120 volts from building Safety: Grounded (lightning) Circuit Breakers Structure
Communication • The server will poll the microcontroller for new data every 60 seconds • A communication protocol was created • Serial Communication via Ethernet using Quatech Serial Device Server
Communication: Serial Device Server • Encapsulates serial data coming from the microcontroller and sends it over Ethernet • Device software on server receives data and creates a virtual serial port • Server uses virtual serial port as if it were an actual serial port
Communication: Protocols Start Emit ENQ SYN DATA DATA TIMEOUT TIMEOUT Checksum Done Emit ACK Checksum Good Checksum Bad Checksum Emit NAK Server-side Protocol SYN TIMEOUT
Server • Polls the microcontroller for data • Calculates • Wind Chill and Dew Point • Averages, Highs, Lows, and Totals • Store measurement data • Generate webpage • Current Weather Conditions • Archived Weather Measurement Data
Server: Data Flow Diagram Calculations Data Acquisition Current Weather Measurements File/Database Archived Weather Measurements File/Database Web Page Generator Archived Measurements Manager
PHP is used to read the current weather measurement data from a file and display the conditions Server: Website • Archived data can be viewed by selecting the month, day, and/or year
Results http://weather.union.edu • All of the sensors have accuracy within 5% • All measurements accurately depict the current weather conditions of the area • The sensors purchased are low maintenance • Station repairs will be simple and explained in a manual
Conclusion What we learned: • System design and implementation • How to handle signal bouncing using both software and hardware approaches • Serial Communication • PHP and HTML • Teamwork and time management skills
Future Work • Add additional sensors to the station • Implement a database to store the current and archived measurement data • Implement a data management program to compress and perform calculations on archived data • Adjust website to obtain the data from the database • Build station structure and mount on top of F.W. Olin building
Thank You • Professor Traver • Professor Hedrick • Professor Spallholtz • Professor Almstead