Download
1 / 19
190 likes | 263 Views
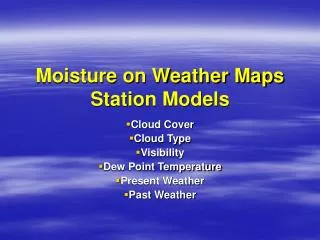
Weather Station Models. Meteorologists use a system of assignment and coding to report a variety of weather conditions at a single location on a weather map. What do Weather Map Symbols look like?. Open to p. 13 of your reference table. What does a weather station tell us?.

E N D
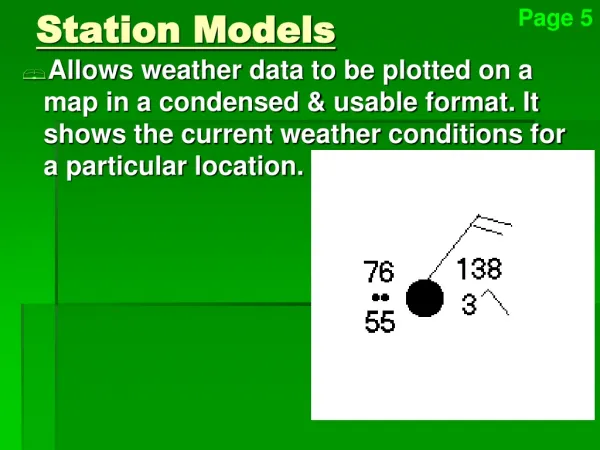
Weather Station Models Meteorologists use a system of assignment and coding to report a variety of weather conditions at a single location on a weather map.
What do Weather Map Symbols look like? • Open to p. 13 of your reference table.
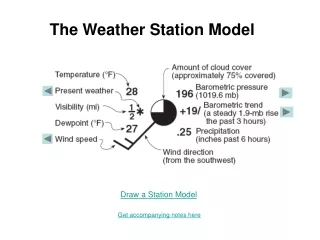
What does a weather station tell us? • The sky around the weather observation station including the amount of cloud cover • The present weather conditions including precipitation type and amount. • The visibility (measured in miles) • The air temperature and dew point (both in degrees Fahrenheit • The wind speed and direction • The barometric pressure (measured in millibars) and the pressure trend.
Cloud Cover • Cloud cover is represented by a pie graph. The amount of the circle that is dark is used to indicate the portion of the sky covered by clouds. It can be empty (0%), shaded by 25%, 50%, 75% or 100%.
Temperature • Temperature, also known as dry bulb temperature, will always be the first number written on the upper left hand side of the model. It is always recorded in Fahrenheit.
Visibility • This indicates the greatest distance, measured in miles, at which objects can be identified.
Present Weather • This term describes the atmospheric conditions such as precipitation or limited visibility. The present weather symbols shown in the box below are examples of what can be indicated on the weather station model.
Dew Point • Dew point is the temperature at which the air would be saturated with water vapor. Although dew point is a temperature it is an indicator of the absolute humidity. In this model, the dew point of 27 degrees F is very close to the air temperature of 28 degrees F. This indicates a high humidity.
Wind Direction • A line connected to the circle indicates wind direction. Remember wind is always named according to the direction it is coming from. In this example the wind direction is south-west.
Wind Speed • Small lines at the end of the wind indicator are called feathers. This example is a 15 knot wind. As printed on the chart 1 knot=1.15 mph. (highlight this)
Precipitation • The amount of rain or snow in the past 6 hours is sometimes shown. In the model below, the weather station has received an amount of snow equivalent to one-quarter of an inch of rainfall.
Barometric Trend • Rising air pressure usually brings clearing weather. Stormy weather is more likely if the atmospheric pressure is going down. A + indicates rising air pressure and a – indicates falling air pressure over the last three hours.
Barometric Trend (continued) • The number on the weather station is in milibars and tenths of millibars. You need to insert a decimal between the two numbers. For example if asked what is the barometric trend you would say a steady rise of 1.9 mb in the past three hours.
Barometric Pressure • Barometric (air) pressure is recorded as a three digit number. It helps to realize that the normal barometric pressure at Earth’s surface is generally 1000 millibars (mb).
How to Interpret Barometric (Air) Pressure • Study This!!!!!! • If the three digit code is less than 500 add a 10 at the beginning and a decimal point before the last number. • If the three digit code is greater than 500 add a 9 before the number and a decimal before the last digit.
Lets Practice • Complete handout (question one see handout)
Question 2 • 2) Draw a station model to represent the following conditions: • Temperature and dew point are 62 degrees Fahrenheit • There is fog • Visibility is only 1/10 of a mile • Winds are from the west at 10 knots • The air pressure is 1002.0 millibars and it has gone down steadily 0.9 millibars in the past three hours. • Cloud cover is 25%.
Question 3 • Draw a station model to indicate: • A temperature of 20 degrees Celsius • A dew point of 11 degrees Celsius • Clear Skies
Summary • Complete questions 27 & 28 on p. 157 of your regent review book.