Download
1 / 1
10 likes | 118 Views
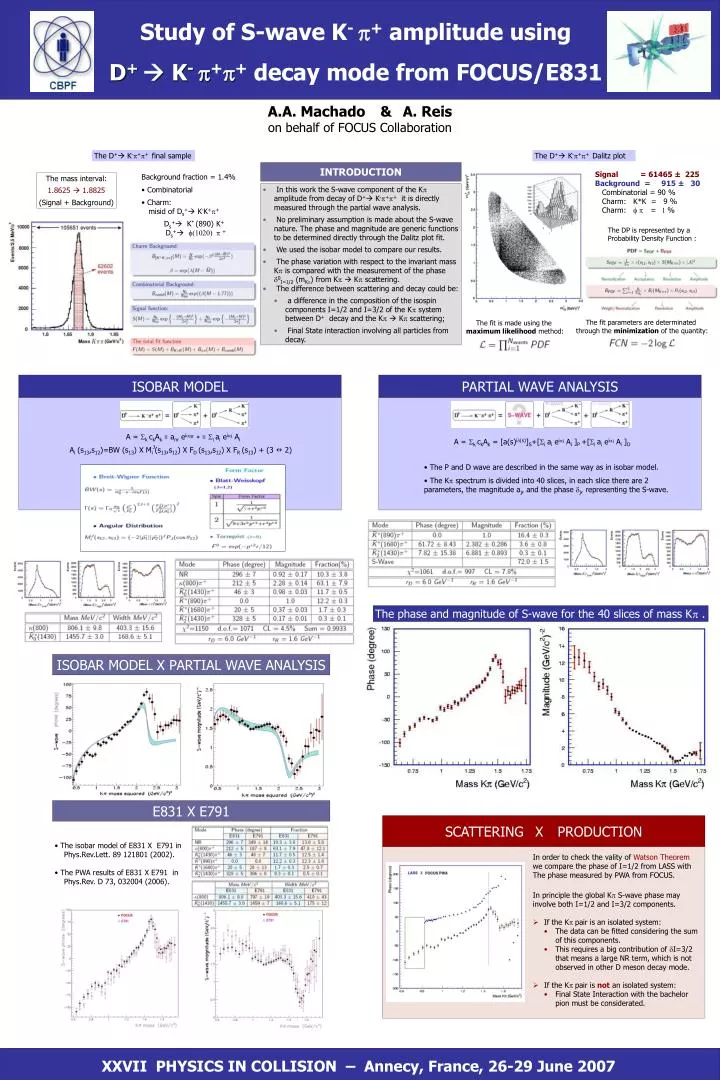
The D + K - p + p + Dalitz plot. The D + K - p + p + final sample. INTRODUCTION. Signal = 61465 ± 225 Background = 915 ± 30 Combinatorial = 90 % Charm: K*K = 9 % Charm: f p = 1 %. Background fraction = 1.4% Combinatorial Charm:

E N D
The D+K-p+p+Dalitz plot The D+K-p+p+final sample INTRODUCTION Signal = 61465 ± 225 Background = 915 ± 30 Combinatorial = 90 % Charm: K*K = 9 % Charm: f p = 1 % • Background fraction = 1.4% • Combinatorial • Charm: • misid of Ds+K-K+p+ • Ds+K* (890) K+ • Ds+f(1020)p + • In this work the S-wave component of the Kp amplitude from decay of D+K-p+p+ it is directly measured through the partial wave analysis. • No preliminary assumption is made about the S-wave nature. The phase and magnitude are generic functions to be determined directly through the Dalitz plot fit. • We used the isobar model to compare our results. • The phase variation with respect to the invariant mass Kp is compared with the measurement of the phase d0I=1/2(mKp) from Kp Kpscattering. • The difference between scattering and decaycould be: • a difference in the composition of the isospin components I=1/2 and I=3/2 of the Kp system between D+decay and the Kp Kpscattering; • Final State interaction involving all particles from decay. The mass interval: 1.8625 1.8825 (Signal + Background) The DP is represented by a Probability Density Function : The fit parameters are determinated through the minimization of the quantity: The fit is made using the maximum likelihood method: ISOBAR MODEL PARTIAL WAVE ANALYSIS A = k ckAk = anr eianr+ = i ai eiai Ai A = k ckAk = [a(s)id(s)]S+[i ai eiai Ai ]P +[i ai eiai Ai ]D Ai(s13,s12)=BW (s13) X MiJ(s13,s12) X FD (s13,s12) X FR (s13) + (3 2) • The P and D wave are described in the same way as in isobar model. • The Kp spectrum is divided into 40 slices, in each slice there are 2 parameters, the magnitude aj, and the phase dj, representing the S-wave. The phase and magnitude of S-wave for the 40 slices of mass Kp . ISOBAR MODEL X PARTIAL WAVE ANALYSIS E831 X E791 In order to check the vality of Watson Theorem we compare the phase of I=1/2 from LASS with The phase measured by PWA from FOCUS. • The isobar model of E831 X E791 in • Phys.Rev.Lett. 89 121801 (2002). • The PWA results of E831 X E791 in • Phys.Rev. D 73, 032004 (2006). SCATTERING X PRODUCTION • In principle the global Kp S-wave phase may • involve both I=1/2 and I=3/2 components. • If the Kp pair is an isolated system: • The data can be fitted considering the sum of this components. • This requires a big contribution of dI=3/2 that means a large NR term, which is not observed in other D meson decay mode. • If the Kp pair is not an isolated system: • Final State Interaction with the bachelor pion must be considerated. Study of S-wave K- p+ amplitude using D+ K- p+p+ decay mode from FOCUS/E831 A.A. Machado & A. Reis on behalf of FOCUS Collaboration XXVII PHYSICS IN COLLISION – Annecy, France, 26-29 June 2007