Download
1 / 20
200 likes | 326 Views
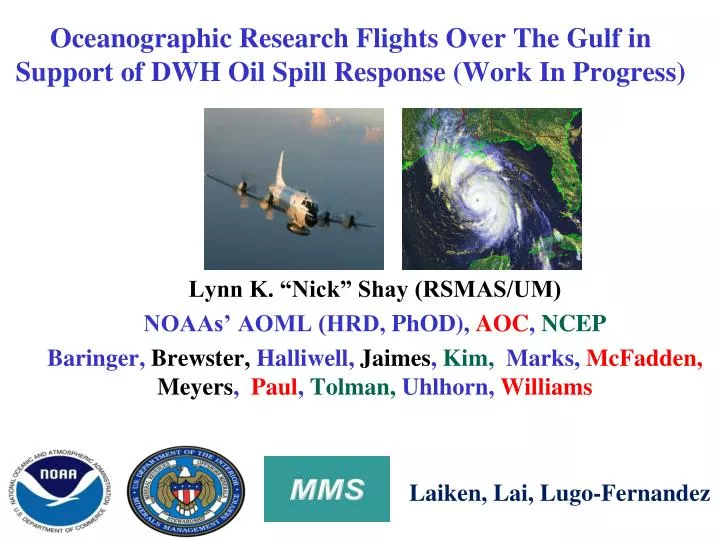
Oceanographic Research Flights Over The Gulf in Support of DWH Oil Spill Response (Work In Progress). Lynn K. “Nick” Shay (RSMAS/UM) NOAAs’ AOML (HRD, PhOD ), AOC , NCEP Baringer , Brewster, Halliwell , Jaimes , Kim, Marks, McFadden, Meyers , Paul , Tolman , Uhlhorn , Williams.

E N D
Oceanographic Research Flights Over The Gulf in Support of DWH Oil Spill Response (Work In Progress) Lynn K. “Nick” Shay (RSMAS/UM) NOAAs’ AOML (HRD, PhOD), AOC, NCEP Baringer, Brewster,Halliwell, Jaimes, Kim, Marks, McFadden,Meyers, Paul, Tolman,Uhlhorn, Williams Laiken, Lai, Lugo-Fernandez
Goal and Objectives: Goal: Provide synoptic snapshots of the Loop Current and surrounding eddy field ‘s thermal, momentum and haline structure. Specific objectives are: Observe temperature, current and salinity structure from NOAA P-3 at 7 to 10 day intervals including the MMS moorings. Resolve mesoscale ocean variability associated with eddy shedding. Provide these data to the National Centers (NAVO) for assimilation into predictive models and vector ships to regimes of variability. Examine the overlying atmospheric structure using GPS sondes relating structure to flight level winds as well as the brightness temperatures from the SFMR. Document SST variations from downward looking IR for oceanic and atmospheric boundary layers.
Plan for NOAA WP-3D profiling over MMS Moorings (In collaboration with AOML HRD, AOC, TPC, NCEP) Deliverables include: V, T, S profiles to 1000 m @ 2-m resolution. Surface winds (SFMR, GPS) provided by HRD. Atmospheric profiles of V, T and RH @ 5-m resolution. Expendables deployed from P-3 and proposed moorings relative to the LC, WCE and CCE superposed on late Sept 05 altimetry derived 26oC isotherm Depth (After Rita).
Approach: • Airborne Expendables (AXCP :1500 m; AXBT: 350 m; AXCTD:1000 m; GPS) deployed in lawnmower pattern across the LC/Warm and Cold eddy features. • Flight level winds, temperatures, etc • Brightness temperatures from the Stepped Frequency Microwave Radiometer (SFMR) • Downward Looking IR • Downward Looking Camera • 9 Flights plus Bonnie Wake • Additional flights may be forthcoming? • Recurrent Theme: Ocean observations critical in improving oceanic and coupled modeling under weak and strong winds.
SFMR Emissivity Versus Surface Wind From GPS sondes (Uhlhorn et al., 2007) SMFR measures emissions expressed in terms of brightness temperatures. Foam coverage increases with winds-emits microwave energy more easily. A new model of emissivity and surface winds is compared to GPS sonde data. Model function behaves differently at about 32 m s-1.
Summary of Flights Overall success rate: 81.5% GPS Dropsondes deployed: 78
Deep Water Horizon Oil Spill Grid Spanning From 24 to 28N using AXBTs, AXCTDs and AXCPs (from Early May 2010). Found Thermostad between 50 to 140 m in water between 19-20C. Notice the coherent structure.
Wind Rows Aligned with Winds-Langmuir Cells? Winds were about 3 to 5 m/s. Alternating convergence and divergence cells Implications redistribution of oil in surface layer and near-surface mixing.
Evaluation of Four HYCOM Nowcasts MODELS: Navy 0.04-degree GOM HYCOM Navy 0.08-degree global HYCOM NCEP/EMC RTOFS Solid lines – No P3 assimilation Dashed lines – With P3 assimilation This evaluation compares temperature from all AXBT profiles over the depth range from 30 to 360 m
AXBT Profiles Three profiles (red) surrounding a bad profile (blue) with mean and 95% confidence. Note the 1-2C offset Implications assimilation scheme.
GPS Sonde on 9 July Flight: Equivalent Potential Temperature (left) and boundary layer winds (U: Center; V right) Three profiles (red) surrounding a bad profile (blue) with mean and 95% confidence. Note the 1-2C offset Implications assimilation scheme.
Some Questions How do we put together a more coherent blueprint for the future? The GOM is an important contributor to ocean circulation that affects SECOORA and MACOORA! Targeted obs (LC or storm-coordinate system) of temperatures, currents and salinities needed to improve the models. Can we solely rely on satellite data sets? How do we combine the various data sets into a coherent mosaic of complex processes that are not CLIMATE scale yet impact ecosystems to hurricane responses? How and what do we effectively assimilate data into the models? How do we engage the DC crowd (program managers) that funding is needed to improve our understanding?
Tracks of Katrina and Rita (2005) in Northern Gulf of Mexico Relative to Oil Rigs. Over 35% of the Rigs were damaged or destroyed in the Gulf. Pain at the pump!