Download
1 / 1
10 likes | 85 Views
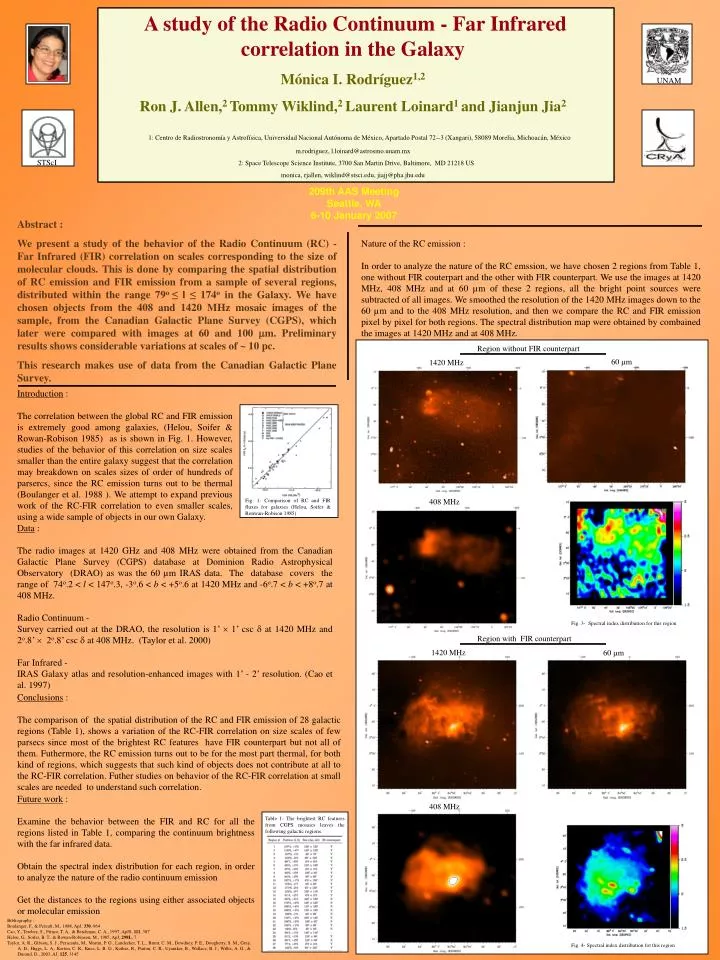
A study of the Radio Continuum - Far Infrared correlation in the Galaxy Mónica I. Rodríguez 1,2 Ron J. Allen, 2 Tommy Wiklind, 2 Laurent Loinard 1 and Jianjun Jia 2

E N D
A study of the Radio Continuum - Far Infrared correlation in the Galaxy Mónica I. Rodríguez1,2 Ron J. Allen,2 Tommy Wiklind,2 Laurent Loinard1 and Jianjun Jia2 1: Centro de Radiostronomía y Astrofísica, Universidad Nacional Autónoma de México, Apartado Postal 72--3 (Xangari), 58089 Morelia, Michoacán, México m.rodriguez, l.loinard@astrosmo.unam.mx 2: Space Telescope Science Institute, 3700 San Martin Drive, Baltimore, MD 21218 US monica, rjallen, wiklind@stsci.edu, jiajj@pha.jhu.edu UNAM STScI 209th AAS Meeting Seattle, WA 6-10 January 2007 Abstract : We present a study of the behavior of the Radio Continuum (RC) - Far Infrared (FIR) correlation on scales corresponding to the size of molecular clouds. This is done by comparing the spatial distribution of RC emission and FIR emission from a sample of several regions, distributed within the range 79o ≤ l ≤ 174o in the Galaxy. We have chosen objects from the 408 and 1420 MHz mosaic images of the sample, from the Canadian Galactic Plane Survey (CGPS), which later were compared with images at 60 and 100 m. Preliminary results shows considerable variations at scales of ~ 10 pc. This research makes use of data from the Canadian Galactic Plane Survey. Nature of the RC emission : In order to analyze the nature of the RC emssion, we have chosen 2 regions from Table 1, one without FIR couterpart and the other with FIR counterpart. We use the images at 1420 MHz, 408 MHz and at 60 µm of these 2 regions, all the bright point sources were subtracted of all images. We smoothed the resolution of the 1420 MHz images down to the 60 µm and to the 408 MHz resolution, and then we compare the RC and FIR emission pixel by pixel for both regions. The spectral distribution map were obtained by combained the images at 1420 MHz and at 408 MHz. Region without FIR counterpart 60 m 1420 MHz Introduction : The correlation between the global RC and FIR emission is extremely good among galaxies, (Helou, Soifer & Rowan-Robison 1985) as is shown in Fig. 1. However, studies of the behavior of this correlation on size scales smaller than the entire galaxy suggest that the correlation may breakdown on scales sizes of order of hundreds of parsercs, since the RC emission turns out to be thermal (Boulanger et al. 1988 ). We attempt to expand previous work of the RC-FIR correlation to even smaller scales, using a wide sample of objects in our own Galaxy. 408 MHz Fig. 1- Comparison of RC and FIR fluxes for galaxies (Helou, Soifer & Ronwan-Robison 1985) Data : The radio images at 1420 GHz and 408 MHz were obtained from the Canadian Galactic Plane Survey (CGPS) database at Dominion Radio Astrophysical Observatory (DRAO) as was the 60 µm IRAS data. The database covers the range of 74o.2 < l < 147o.3, -3o.6 < b < +5o.6 at 1420 MHz and -6o.7 < b < +8o.7 at 408 MHz. Radio Continuum - Survey carried out at the DRAO, the resolution is 1’ 1’ csc at 1420 MHz and 2o.8’ 2o.8’ csc at 408 MHz. (Taylor et al. 2000) Far Infrared - IRAS Galaxy atlas and resolution-enhanced images with 1’ - 2’ resolution. (Cao et al. 1997) Fig. 3- Spectral index distribution for this region Region with FIR counterpart 1420 MHz 60 m Conclusions : The comparison of the spatial distribution of the RC and FIR emission of 28 galactic regions (Table 1), shows a variation of the RC-FIR correlation on size scales of few parsecs since most of the brightest RC features have FIR counterpart but not all of them. Futhermore, the RC emission turns out to be for the most part thermal, for both kind of regions, which suggests that such kind of objects does not contribute at all to the RC-FIR correlation. Futher studies on behavior of the RC-FIR correlation at small scales are needed to understand such correlation. Future work : Examine the behavior between the FIR and RC for all the regions listed in Table 1, comparing the continuum brightness with the far infrared data. Obtain the spectral index distribution for each region, in order to analyze the nature of the radio continuum emission Get the distances to the regions using either associated objects or molecular emission 408 MHz Table 1- The brightest RC features from CGPS mosaics leaves the following galactic regions. Bibliography : Boulanger, F., & Perault, M., 1988, ApJ, 330, 964 Cao, Y., Terebey, S., Prince, T. A., & Beichman, C. A., 1997, ApJS, 111, 387 Helou, G., Soifer, B. T., & Rowan-Robinson, M., 1985, ApJ, 298L, 7 Taylor, A. R., Gibson, S. J., Peracaula, M., Martin, P. G., Landecker, T. L., Brunt, C. M., Dewdney, P. E., Dougherty, S. M., Gray, A. D., Higgs, L. A., Kerton, C. R., Knee, L. B. G., Kothes, R., Purton, C. R., Uyaniker, B., Wallace, B. J., Willis, A. G., & Durand, D., 2003, AJ, 125, 3145 Fig. 4- Spectral index distribution fot this region